









Optimisation
Also called Optimization, Parameter optimisation, Strategy optimisation, Backtest optimisation, EA optimisation
Optimisation is running a trading strategy on past price data many times with different settings, then ranking the runs to find the combination that scored best. It shows what would have worked in that period, not what will work next.
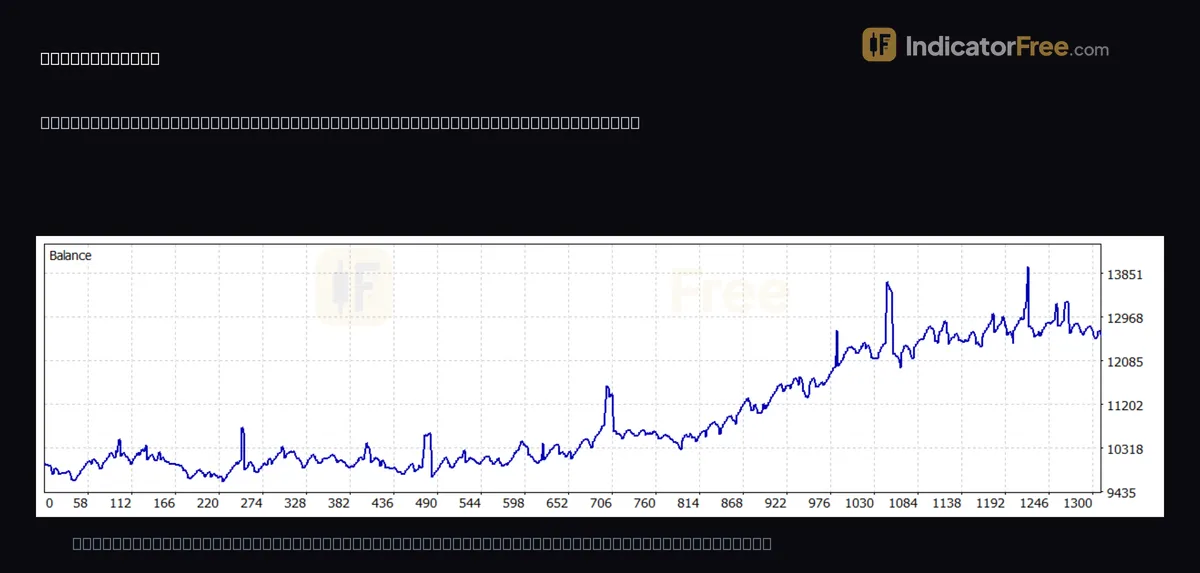
The top result of an optimisation is the one most likely to be flattered by luck, because it was picked out of hundreds or thousands of tries. If you size your trades from that number, you are risking real money on the luckiest version of the past.
What optimisation does to a strategy's settings
Every rule-based strategy or Expert Advisor (EA, a program that trades the rules for you) has inputs: an average period, a stop distance, the hours it may trade. Optimisation reruns the same backtest with different values for those inputs. It then ranks the runs by a score you choose, such as net profit, profit factor (gross profit divided by gross loss) or drawdown.
Its useful job is to show which ranges of settings behave sensibly and which break the strategy. Its risk is curve fitting: settings that match the random noise of one stretch of history and nothing else.
How an optimisation run is set up: inputs, steps and the score you rank by
In the strategy tester of your trading platform, you give each input you tick a start value, a step and a stop value. The tester multiplies the counts together, so three inputs with 20 values each become 8,000 runs, as in the worked example below.
You also choose the score used for ranking and the search method. A full search runs every combination. A genetic search samples the combinations to finish faster, and may skip some, so its top result can sit on a peak it never tested the neighbours of. Re-run the area around it with a full search before trusting it.
Many testers let you reserve the final part of the data as a forward period. Results appear as a sortable table and often as a heat map, a grid of two inputs where each cell is coloured by its score. A block of similar-coloured cells is a plateau. A single bright cell surrounded by dull ones is a peak.
Use this as a decision rule. If moving the best value one step either side turns a profit into a loss, discard it, even when its score beats every cell in the plateau.
A worked example: 8,000 runs and what survives on new data
The figures here are an illustrative example. You optimise a moving-average crossover EA with three inputs and try 20 values for each. You split 18 months of history in two: the first 12 months for optimising (in-sample) and the last 6 months held back and never shown to the optimiser (out-of-sample). Repeating this in-sample / out-of-sample split across rolling windows of history is called walk-forward testing.
The best run made $6,000 in-sample. The same settings made $600 on the held-back 6 months.
The settings kept only 20% of their monthly pace. A working rule: if the held-back period keeps less than about half of the in-sample pace, treat the result as fitted and do not trade it.
The same logic applies to risk. The optimiser also picked the run where drawdown happened to be small. A working rule: size your lots as if the drawdown were twice the one the report shows, so a reported 10% drawdown is planned as 20%.
What to check on the report of your chosen settings
Once you have picked settings, run them as a single backtest and read its report as a check on the optimisation, not as proof. The report at the top of this page is one such single backtest: an EA on XAUUSD, 15-minute chart, from 24 March 2026 to 24 September 2026, a period of six months. We don't know how these settings were picked, so treat this report as practice material for the checks below, not as proof the EA works. It shows 899 trades and a profit factor of 1.11. It is a past example, not a prediction.
The report gives two drawdown figures. Maximum equity drawdown, the largest peak-to-trough fall of the account counting open trades, is 6.56%. Maximum balance drawdown, the same fall measured on closed trades only, is 12.58%.
Equity drawdown is usually the larger of the two, so this order looks odd. It can happen when the balance reaches a high while losing trades are still open, so when they close, the balance falls from a peak that equity, already held down by those open losses, never reached.
Size from the larger one: 12.58% × 2 ≈ 25% planned drawdown.
The common misread is to treat one report as proof. A report is one set of settings on one period. It cannot tell you how many other sets were tried, or whether the neighbouring values held up.
Two numbers on the report still help you decide whether to keep testing: The 899 trades pass the sample-size check: a top run with only a few dozen trades can owe its rank to luck, which 899 trades hide less easily. The profit factor of 1.11 means $1.11 of gross profit for every $1.00 of gross loss, a thin edge that slightly higher live costs could erase.
Checks before you trade optimised settings
- If you must test four or more inputs, fix the ones you have a reason for and optimise only the rest.
- Use wide steps first to find the profitable region. Then use finer steps inside it to confirm the neighbours also hold up.
- Re-test the chosen settings on a second symbol or a different period. Settings that only work on one stretch of one market are likely fitted.
- Include realistic spread, commission and swap in the test, or a thin edge is only on paper.
- Run the chosen settings on a demo account before real money.
FAQ
How often should I re-optimise an EA?
Set the schedule before you start and keep to it. Use the same lengths you tested: in the example above, that means re-optimising on the latest 12 months once every 6 months. Outside that schedule, re-optimise only when live drawdown exceeds your planned (doubled) drawdown from the sizing rule above. Re-optimising every time the EA has a losing week only refits it to the latest noise.
Can I optimise an indicator's settings without an EA?
Not automatically. A tester needs entry and exit rules to score a run, so the indicator has to be wrapped in a simple EA first. By hand, you can only compare a few values on the chart, which is slow and easy to bias.
Why does the same optimisation give different results at another broker?
Price history, spreads, commissions and server time differ between brokers, so the same rules trade on slightly different bars. If the best settings only work on one broker's data, treat that as another sign of fitting.