









Range trading
Also called Trading range, Range-bound trading, Sideways market trading
Range trading means buying near the floor and selling near the ceiling of a sideways price zone. You are betting that price keeps bouncing between those two edges until the range breaks.
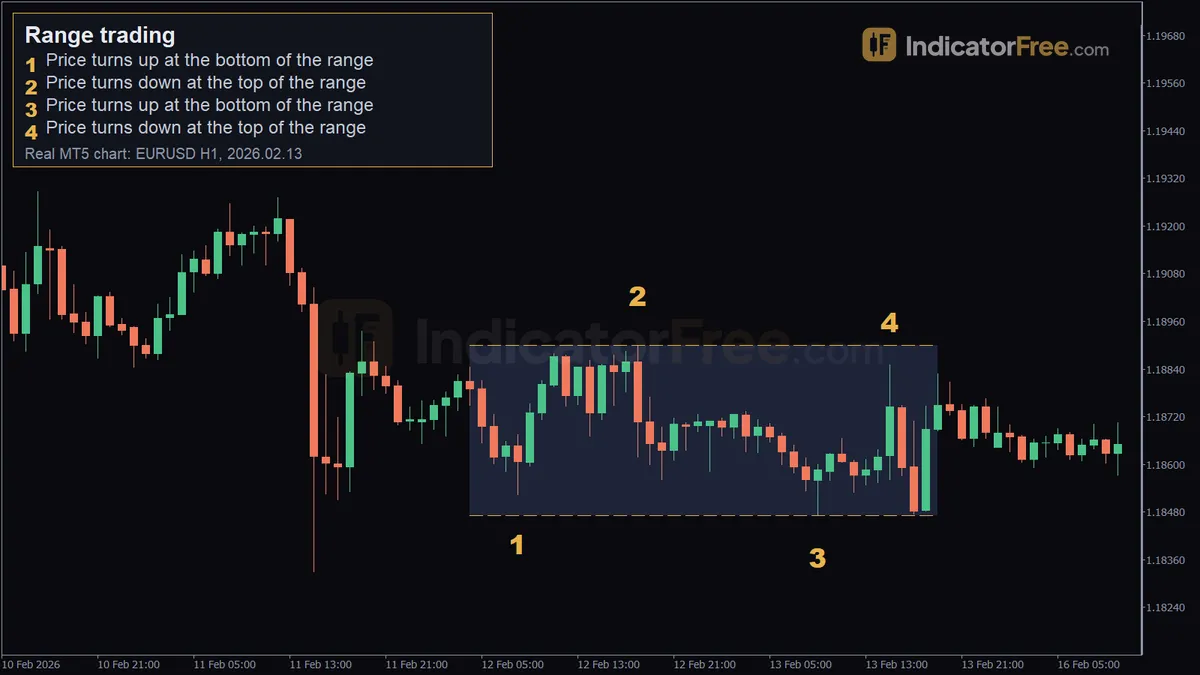
Ranges look easy because you can see the edges clearly once the move is over. Whether you make or lose money depends on two details many traders skip. The first is how far beyond the edge you put your stop. The second is whether you take profit before the opposite edge instead of waiting for a perfect fill.
How to tell a tradable range from random chop
- Turns at both edges. Price has turned at least once near the top and once near the bottom, with a clear swing between them. That gives you a plan. Your first trade comes when price returns to an edge that has already held.
- Flat edges. The highs sit in a narrow band, and so do the lows. If both slope the same way, you are looking at a channel, not a range.
- Room to trade. The range should be at least twice as tall as your planned stop. The February EURUSD range in the chart at the top of this page is 43 pips tall, so stops there must stay under about 21 pips.
- Full swings. Price travels from one side to the other. If it keeps pressing against one edge, pressure is building there.
- Quiet volatility. The Average True Range (ATR, a measure of typical candle size) is flat or falling. If ATR is rising, candles are getting bigger and the edges are under stress.
- No big event while you hold. A rate decision or a jobs report can end a range in one candle.
When a range is weak or already broken
A strong range shows sharp rejections: long wicks at the edges and quick moves away from them. In a weak range, the touches come closer together in time, or the lows rise toward a flat top (or the highs fall toward a flat bottom). That squeeze often comes just before a range ends.
A range is broken when a candle closes beyond an edge on your trading timeframe and the next candle also stays outside. A wick that pokes through and then closes back inside is not a break. It may be a stop hunt or a false breakout.
Traders misread this both ways. Some treat every poke as the end of the range. Others treat a real close outside as just another poke. Use this rule. One close outside: stop opening new range trades. Second candle also outside: the range is over, so close or tighten any open range trade. Price closes back inside on the next candle: the range is alive, and its edge moves to the new extreme. From then on, put the stop for any new range trade beyond that new extreme.
Reading the EURUSD 1-hour range of 12–13 February 2026
The chart at the top of this page is a past example, not a prediction. From 12 February 2026, 04:00 to 13 February, 19:00, EURUSD on the 1-hour chart stayed between 1.18471 and 1.18900. That range was 43 pips tall, and price turned at the edges at least four times.
- Marker 1 (12 Feb, 08:00, 1.18523): price turns up. One bounce does not make a range. It is just a low.
- Marker 2 (12 Feb, 18:00, 1.18900): price turns down. Now you have a possible floor and ceiling, with one touch each. You can plan, but it is too early to trade.
- Marker 3 (13 Feb, 09:00, 1.18471): price turns up again, but 5.2 pips below marker 1 (1.18523 − 1.18471). The floor is a zone, not a line. A stop one or two pips under 1.18523 would have been hit just before the bounce.
- Marker 4 (13 Feb, 15:00, 1.18851): price turns down 4.9 pips short of the 1.18900 high. Sellers stepped in early. An order waiting exactly at the old high would not have filled.
Together, markers 3 and 4 show that edges can overshoot and undershoot. Place entries slightly inside the edge and stops clearly outside it.
Where to enter inside a range: the outer-quarter rule
Divide the range height by four. Buy only in the bottom quarter, sell only in the top quarter, and stay out of the middle half. An entry in the middle forces a wider stop and leaves only about half the range as room to your target.
The February range is 43 pips tall, so a quarter is about 11 pips. That means buying only within about 11 pips above 1.18471 and selling only within about 11 pips below 1.18900. Add a second rule: if the distance from your entry to the far quarter is less than 1.5 times your stop, skip the trade.
The illustrative chart below shows the rule on round numbers. The trade zones are shaded, and one wick dips below the floor but the candle closes back inside.
Two range trades on the February EURUSD chart
Both trades use the real edges of the chart at the top. The entries, stops and targets are an illustrative plan, not trades anyone actually placed.
Buying the floor on the second test
After marker 2, the floor is 1.18523 and the ceiling is 1.18900. Place a buy limit at the first low, 1.18523. Put the stop 15 pips under your entry, so a shallow overshoot cannot reach it. Set the target five pips under the 1.18900 ceiling, which is 32.7 pips above your entry. You risk 15 pips to make about 33.
At marker 3, price dropped to 1.18471. The order filled, and price turned 5.2 pips below the entry, far from the stop. At marker 4, the high of 1.18851 went 0.1 pip past the target, so it filled. A target at 1.18900 would never have filled.
Selling the ceiling on the fourth touch
After marker 3, the range runs from 1.18471 to 1.18900. Place a sell limit five pips under the 1.18900 high, with the stop 10 pips above that high and the target five pips above the 1.18471 low. Again you risk 15 pips, this time to make about 33. The marker 4 high of 1.18851 filled the order with 0.1 pip to spare. The facts for this chart end at 19:00 with price still inside the range, so we can show where the order sat but not how the trade finished.
Here is how to size either trade. The illustrative account holds $15,000 and risks 1% on EURUSD, where one standard lot (100,000 units) moves $10 per pip.
Range trading vs trend and breakout trading
| Style | Market it needs | Where you enter | Main risk |
|---|---|---|---|
| Range trading | Sideways, flat edges | Near an edge, betting on a turn back | The range ends while you are in |
| Trend trading | Higher highs or lower lows | On pullbacks, with the trend | The trend stalls into a range |
| Breakout trading | A range about to end | Beyond an edge, after a close | False breakouts |
Range traders and breakout traders watch the same edges and take opposite sides, so a range trader's stop is often a breakout trader's entry.
When range trading works and when to stay out
Range trading tends to work best in quiet hours with no scheduled news, after a strong move has stalled, and when a pair is moving less than its average daily range. Stay out ahead of major releases and around session opens, when fresh volume arrives and tests the overnight range. Also stay out when the range is tightening into a coil or ATR is rising.
| Pros | Cons |
|---|---|
| Clear entry, stop and target levels | One break can erase several wins |
| Many setups while the market is quiet | Profit is capped by the range height |
| Stops are small compared with the target | The spread takes a big share of a thin range |
| Rules are easy to write down and test | Edges overshoot and undershoot, as markers 3 and 4 show |
Bullish and bearish ranges
In an uptrend, traders usually read a range as a pause, so focus on buying the floor and skip the ceiling. If the range ends with a close above the top, that is a Range breakout, covered in its own entry. In a downtrend, focus on selling the ceiling. A close below the floor is the bearish version of a Range breakout, and a break that snaps back inside is explained under False breakout.
Quick range-trade checklist
- Turns at both edges, flat highs and lows, ATR not rising.
- Entry in the outer quarter, stop beyond the most extreme wick.
- Reward to the far quarter at least 1.5 times the risk.
- Once price passes the middle of the range, move your stop to the entry price.
- No major news before your planned exit.
FAQ
What is a Wyckoff trading range?
In the Wyckoff method, a trading range is the sideways phase where large players are thought to build positions (accumulation) or sell them off (distribution) before the next trend. Wyckoff traders watch closely for a quick dip below the floor that snaps back inside, which they call a spring.
Which indicators help with range trading?
An oscillator such as RSI or Stochastic can show that price is stretched at an edge, and a flat ATR shows the market is quiet. Neither one replaces the edges themselves. Price levels come first.
Can I range trade on the daily chart?
Yes. The rules are the same, but daily ranges are wider. Your stop in pips gets larger, so your lot size must shrink to keep the same amount of money at risk.