









ATR trailing stop loss
Also called ATR trailing stop, ATR trail, ATR trailing SL, volatility trailing stop
An ATR trailing stop loss is a stop that follows price at a distance of the Average True Range (ATR) times a multiplier. It moves only in your favour, and sits wider when candles are big and tighter when they are small.
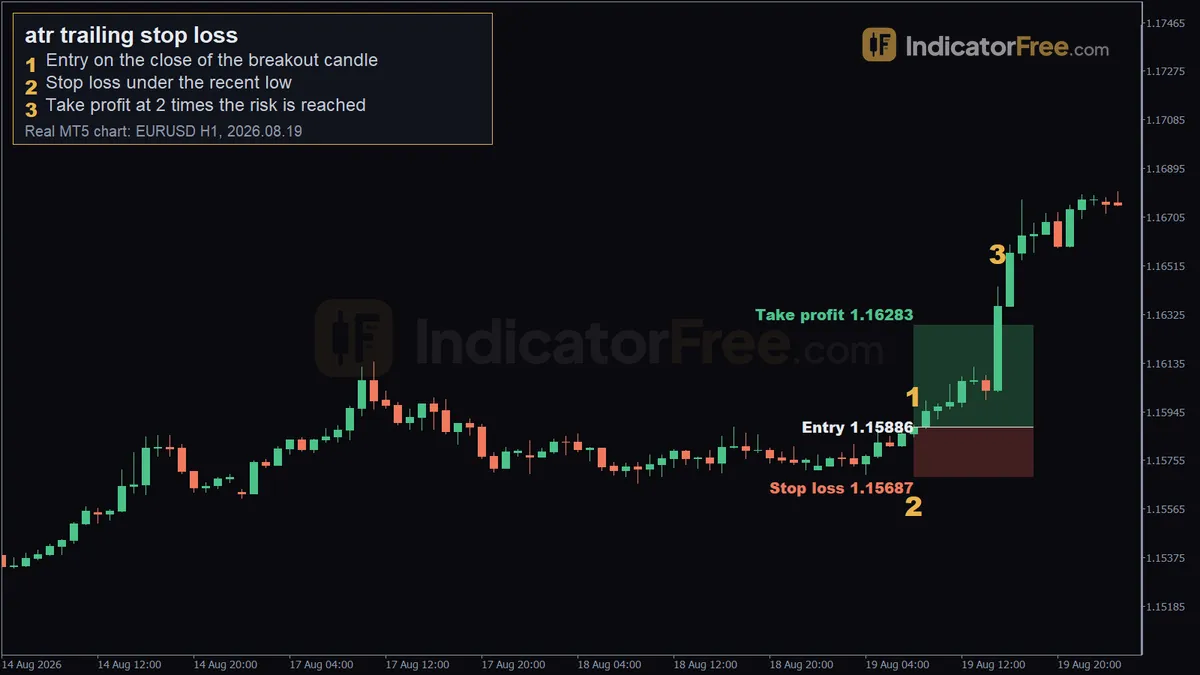
A fixed 20-pip trail is too tight on a fast day and too loose on a quiet one. An ATR trail adjusts by itself. And because you know the ATR distance before you enter, you can size the lot so a stop-out costs a fixed share of your account.
The trade at the top used a fixed stop and a 40-pip target. With a 2 × ATR trail it would have had no target and stayed open until price fell back to the trail.
The ATR trailing stop formula for longs and shorts
Trail distance  = ATR(period) × multiplier

Long trade:  candidate stop = highest high since entry − trail distance
             new stop       = the higher of (old stop, candidate stop)

Short trade: candidate stop = lowest low since entry + trail distance
             new stop       = the lower of (old stop, candidate stop)
ATR is the average true range of recent candles. The true range counts the jump from the previous close as well as the candle's own high-to-low. The period is the number of candles averaged; 14 is the common setting, as in the Lab figures further down.
The second line of each pair is the ratchet rule: the stop may move toward profit, never back toward risk. Without it you have a floating band, not a trailing stop.
Recalculate once per closed candle. The ATR of a candle that is still forming keeps changing, and so would your stop.
The trailing stop built into most order windows uses a fixed distance, not ATR. So you move the stop yourself to the ATR line after each candle closes.
The real EURUSD chart in the next section shows the shape this produces: steps up while price makes new highs and flat stretches during pullbacks.
An ATR trailing stop on real EURUSD 1-hour candles
This is the same buy as the chart at the top, entered at 1.15886 on 2026.08.19 08:00, but managed with a trail instead of a target. The gold line is a 2 × ATR(14) trail under the highest high since entry. The dashed line is a fixed 20-pip trail. ATR here is the average of the last 14 true ranges in these candles. This is a worked example on past data, not a prediction.
- Quiet start. ATR(14) was between about 6 and 7.4 pips before 15:00, so the ATR trail sat closer to price than the fixed 20-pip trail.
- Flat on a pullback. On the 14:00 candle the highest high since entry stayed the same, but ATR grew because that candle was wide. A bigger ATR means a wider trail distance, so the candidate stop fell to 1.15970. That was below the old stop, so the trail stayed at 1.15975.
- Steps up each new high. 1.16232 after 15:00, about 1.16367 after 16:00, 1.16521 after 17:00. That last step sat about 25 pips under the 1.16772 high, because ATR had grown to about 12.5 pips.
- Fixed trail out first. The 18:00 candle dipped to 1.16568 and hit the fixed trail at 1.16572, 68.6 pips above entry. The ATR trail stayed flat at 1.16521 through that dip and the 20:00 pullback.
- Still open. At 03:00 on 2026.08.20, where this data ends, the ATR trail was at 1.16542, 65.6 pips above entry, and the trade was still running. This data does not show where it would have closed.
Where the data ends, the fixed trail had locked more: 68.6 pips against 65.6 pips. The ATR trail gave back more on the 18:00 dip, but it is still in the trend, and the fixed trail is shut out of any further move. If you want to hold a trend through the London/New York overlap, use the ATR trail; if you take quick moves, a fixed or tighter trail locks more.
Worked ATR trail for 500, 5,000 and 50,000 USD accounts
The figures here are an illustrative example. You buy a USD-quoted pair at 1.1000, ATR reads 25 pips, your multiplier is 2, and you risk 1% of the account. One standard lot (100,000 units) is worth $10 per pip. The steps follow the 5,000 USD account.
- Trail distance: 25 pips × 2 = 50 pips. Initial stop: 1.1000 − 0.0050 = 1.0950.
- Risk in money: $5,000 × 1% = $50.
- Lots = risk ÷ (distance × $10). That gives $50 ÷ $500 = 0.10 lots, so each pip is worth $1.
- Price climbs to a highest high of 1.1120. Candidate stop: 1.1120 − 0.0050 = 1.1070. That is above 1.0950, so the stop moves up.
- The stop now sits 70 pips above entry. Locked profit: 70 × $1 = $70.
- ATR then grows to 30 pips with no new high. Candidate stop: 1.1120 − 0.0060 = 1.1060. That is below 1.1070, so the stop stays at 1.1070.
- ATR then shrinks to 20 pips, still with no new high. Trail distance: 20 × 2 = 40 pips. Candidate stop: 1.1120 − 0.0040 = 1.1080. That is above 1.1070, so the stop moves up without a new high. Locked profit is now 80 pips = $80.
A short trade mirrors this. Sell at 1.1000 with the same 50-pip distance and the first stop is 1.1050. When the lowest low reaches 1.0900, the candidate is 1.0900 + 0.0050 = 1.0950, and the stop only moves down.
The same steps for the 500 and 50,000 USD accounts give this quick reference:
| Account | 1% risk | Trail distance | Lots | Value per pip | Locked with stop at +70 pips |
|---|---|---|---|---|---|
| $500 | $5 | 50 pips | 0.01 | $0.10 | $7 |
| $5,000 | $50 | 50 pips | 0.10 | $1 | $70 |
| $50,000 | $500 | 50 pips | 1.00 | $10 | $700 |
The distance is the same for every account. Only the lot size changes.
How wide the trail is on real EURUSD and gold data
The IndicatorFree Lab figures in this entry are past data, not a forecast. EURUSD 1-hour ATR(14) averaged 11.6 pips from 2025-10-20 to 2026-10-21 (6222 candles). Half the readings were below 10.8 pips and the highest 10% were above 16.3 pips. A multiplier of 2 would have meant a trail of about 23.2 pips on average.
Session changes the candle size: in the same data, the average 1-hour candle was 8.8 pips in Asian hours (01:00-09:59 server time) and 17.9 pips in the London/New York overlap (15:00-18:59). One ordinary overlap candle was wider than the average ATR, so a trail of 1 × ATR set during quiet hours sits inside normal overlap movement.
The unit changes with the instrument. XAUUSD 1-hour ATR(14) averaged 21.7 $ from 2025-10-20 to 2026-10-21, so a gold trail is counted in dollars of price, not pips. A multiplier of 2 gives about 43.4 $ on average. Typical readings: half below 18.8 $, the busiest 10% above 31.7 $. At 2 ×, that is a trail of about 38 $ on a normal day and over 63 $ on a busy one.
Mistakes that break an ATR trailing stop
- Sizing the lot before the trail distance. Size the lot after the trail distance, never before. If you widen the multiplier, cut the lots so the money at risk stays the same.
- Mixing timeframes. In the Lab data above, EURUSD 4-hour ATR(14) averaged 24 pips against 11.6 pips on the 1-hour. The same multiplier of 2 gives about 48 pips instead of about 23.2, so take ATR from the chart you manage the trade on.
- Placing the first stop tighter than the trail distance. The trail then does nothing until price has run the difference, and your lot size no longer matches the distance the trail uses.
- Trailing from the close in one place and the high in another. Pick one reference price and keep it for the whole trade, or your stop levels will not match your plan.
FAQ
What ATR multiplier should I use for a trailing stop?
Match it to the candles you will hold through. If you hold through the London/New York overlap, start at 2 × ATR or more. If normal pullbacks stop you out twice in a row, raise it by 0.5 and cut the lots to keep the same risk. A higher multiplier holds longer trends and gives back more at the end.
Does an ATR trailing stop protect me from gaps and slippage?
No. When price reaches the stop it becomes a market order, so a gap or a fast move can fill you at a worse price than the line showed.
Can I use the ATR trailing stop line as an entry signal?
Some traders buy when price closes above the line and sell when it closes below. In a sideways market the line flips often and produces a string of small losses, so it works better as an exit rule than as a full strategy.