









Squeeze momentum
Also called TTM Squeeze, Squeeze Momentum Indicator, Volatility squeeze
Squeeze momentum is a volatility setup. Bollinger Bands tighten inside a Keltner Channel (the squeeze), then a momentum reading shows which way price is pushing as the bands widen again.
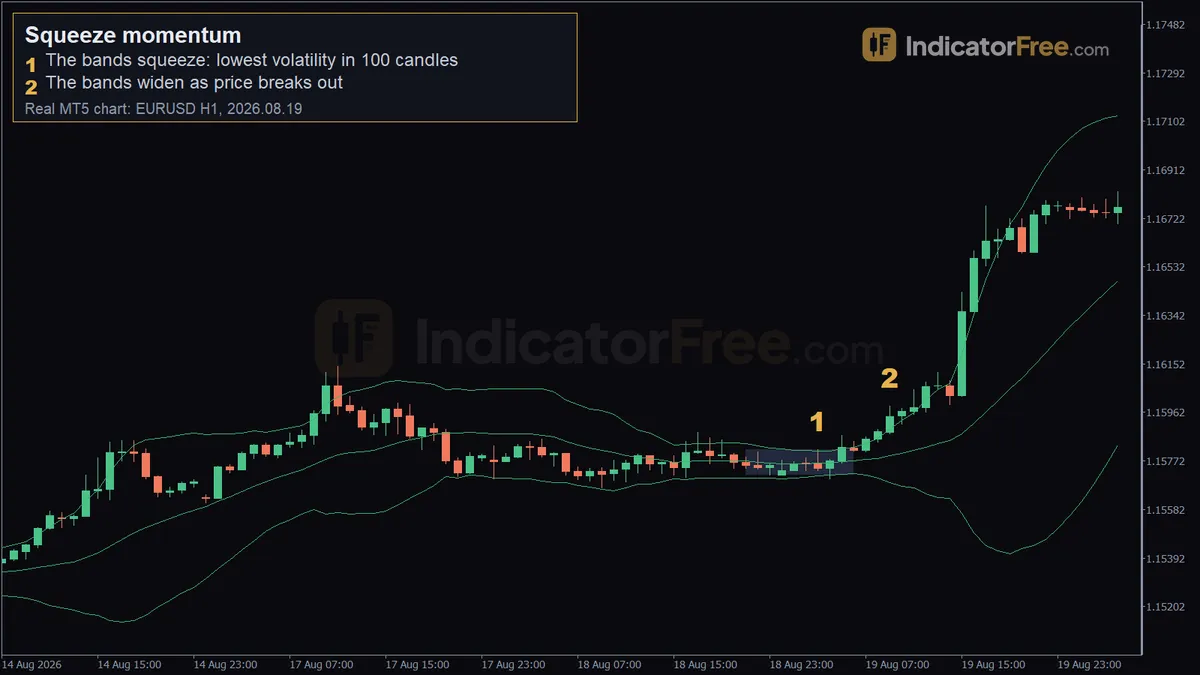
A squeeze tells you when a market is coiled. Momentum tells you which way it is starting to move. A common mistake is trading only one of these: you buy the first spike out of a quiet range, or you keep waiting on a squeeze that has already broken the other way.
How to spot a squeeze momentum setup
Two tools measure how far price spreads around a 20-period average. Bollinger Bands measure it with standard deviation. A Keltner Channel measures it with average true range. When the Bollinger Bands slide inside the Keltner Channel, volatility is unusually low. That state is the squeeze.
The chart below shows the bands sliding inside the channel over the quiet candles, then pushing back outside at the release.
Check these in order:
- Bollinger Bands (20, 2) sit inside the Keltner Channel, or band width is at its lowest of the last 100 candles.
- Candles get smaller and overlap. You can draw a tight box around the last several bars.
- The momentum reading hugs its centre line and has no clear direction yet.
- The squeeze releases. The bands push back outside the Keltner Channel and start widening.
- Momentum leaves the centre line in one direction and grows for at least two bars.
- A candle closes beyond the high or low of the squeeze box, on the same side as momentum.
Most squeeze tools show momentum as a histogram around zero. The classic Momentum indicator is different. In MT5 its default is period 14 on the close, and it is plotted as close ÷ close 14 bars ago × 100, so its centre line is 100, not 0. If you use it, read "above 100" as "above zero".
The chart below shows the full sequence: quiet bars and a flat histogram, then the release.
Strong, weak and broken squeezes
A strong squeeze is long and tight. You see many small candles and bands clearly inside the channel. When it releases, momentum and the breakout candle agree.
A weak squeeze is short (only a few bars) or shallow, with the bands barely inside the channel. It often releases into a small move that stalls.
A squeeze is broken when price closes outside the box but momentum points the other way. It is also broken when momentum flips back across its centre line within a couple of bars. Treat either case as a fakeout, not a late entry.
One common misread: a single close outside the Bollinger Bands is not a breakout on its own. The IndicatorFree Lab counted that 13.2% of EURUSD 1-hour candles closed outside Bollinger Bands (20, 2) between 2025-10-02 and 2026-10-02 (past data, not a forecast). That is more than one candle in eight. You need the squeeze before the close and momentum behind it.
The volatility half on its own is covered under Bollinger Band squeeze. A momentum turn without a squeeze is a momentum shift.
Reading the EURUSD 1-hour squeeze of 19 August 2026
The chart at the top of the page is a past example, not a prediction.
- Marker 1 (19 August 2026, 03:00, 1.15817): the Bollinger Bands (20, 2) were only 10 pips wide, the narrowest in 100 candles. This is the squeeze, with volatility at its lowest in 100 candles.
- Marker 2 (19 August 2026, 09:00, 1.15987): six hours later the bands were twice as wide and price had moved 103 pips. The bands widened as price broke out, and this marker sits above the squeeze level.
The lesson is about timing. At marker 1 nothing tells you the direction yet. The trade decision belongs at the release, once momentum and the breakout candle point the same way.
Two ways to trade the squeeze release
Setup 1: enter on the first close outside the squeeze box
- Entry: at the close of the first candle that ends beyond the box, with momentum already on that side of its centre line.
- Stop loss: just beyond the opposite side of the squeeze box.
- Target: at least twice the stop distance. Exit early if the histogram prints its first shorter bar.
Setup 2: enter on the first pullback after the release
- Entry: after the breakout, wait for price to drift back toward the edge of the box or the middle band. Momentum must stay on the breakout side. Enter when a candle closes back in the breakout direction.
- Stop loss: beyond the pullback low for a buy, or the pullback high for a sell.
- Target: the extreme of the release move first, then trail the rest.
Setup 2 gives you a better price, but you miss every move that never pulls back.
Here is an illustrative example with round numbers so you can redo the maths. You have a $10,000 account and risk 1% per trade. You take Setup 1 on EUR/USD: the squeeze box low sits 25 pips below your entry, and one standard lot (100,000 units) is worth $10 per pip.
At 0.40 lots each pip is worth $4. If the stop is hit you lose 25 × $4 = $100. If the target is hit you gain 50 × $4 = $200.
When squeeze momentum works, and when to skip it
It fits best when a quiet spell runs into a known catalyst, such as a session open or a scheduled data release. Skip it in thin holiday trading, in the minutes before high-impact news (a spike can take out both sides), and when the box sits right under a major support or resistance level.
Your timeframe sets how often you see a squeeze. The Lab counted new 100-candle lows in Bollinger Band width on broker demo data from 2025-10-02 to 2026-10-02 (past data, not a forecast):
| Market and timeframe | Squeezes per month |
|---|---|
| EURUSD 1-hour | 4.5 |
| EURUSD 4-hour | 0.9 |
| Gold (XAUUSD) 1-hour | 4.7 |
| Gold (XAUUSD) 4-hour | 1.4 |
On the 1-hour chart that is roughly one squeeze a week, so you can afford to pass on the weak ones. On the EURUSD 4-hour chart a squeeze came about once a month.
| Pros | Cons |
|---|---|
| Tells you when to pay attention, so you stop forcing trades in dead markets | Gives no direction until the release |
| Two separate checks: volatility and momentum | Momentum lags, so part of the move is gone by the time it confirms |
| Clear invalidation at the far side of the box | News spikes can break out both ways |
| Works on any market with price data | Loose settings produce many weak squeezes |
Practical tips for squeeze momentum
- Draw the box. Mark the high and low of the squeeze candles before the release. Those lines become your entry trigger and your stop.
- Wait for the candle to close. Wicks that poke outside the box often snap back.
- If momentum crosses back against you within two bars of entry, close the trade. Don't wait for the stop.
- Check the next higher timeframe. A bullish 1-hour release against a 4-hour downtrend is a weaker trade.
- Use the same settings on every chart so squeezes stay comparable.
Pre-trade go/no-go check
- Catalyst ahead, such as a session open or a scheduled release? If not, the squeeze may just fade.
- High-impact news due in the next few minutes? If yes, no trade.
- Box sitting right under a major support or resistance level? If yes, skip it.
- Next higher timeframe agrees with the breakout direction? If not, pass.
FAQ
What is momentum trading?
Momentum trading means buying markets that are already rising and selling markets that are already falling, betting the move continues for a while. Squeeze momentum is one version of it: you wait for a quiet spell, then trade the momentum that breaks out of it.
Should I use Bollinger Bands (20, 2) or (20, 2.5) for the squeeze?
(20, 2) is the standard setting. Wider bands make a close outside them rarer: on EURUSD 1-hour from 2025-10-02 to 2026-10-02, 13.2% of candles closed outside Bollinger Bands (20, 2) and 5% closed outside (20, 2.5) (past data, not a forecast). With 2.5 a close beyond the band marks a bigger push, but you get fewer signals. Whichever you pick, keep it the same on every chart.
Can I trade squeeze momentum without a Keltner Channel?
Yes. Use Bollinger Band width instead: a new 100-candle low in band width marks the squeeze, which is how the Lab counted them. Pair it with any momentum reading and apply the same checklist.