









rsi 6 12 24
Also called RSI 6-12-24, RSI(6,12,24), triple RSI, three-line RSI, 6 12 24 RSI
RSI 6 12 24 is three Relative Strength Index lines with periods 6, 12 and 24 drawn in one panel. The 6 line reacts fastest, the 24 line shows the slower momentum trend, and you read how the three line up.
One RSI line forces a trade-off: a short period gives many false alarms, a long one reacts late. Three lines show both at once, so you can see whether an overbought reading (above 70) is a one-candle spike or a move the slower lines also confirm. An oversold reading (below 30) is judged the same way in reverse. That difference decides whether you fade a move (trade against it) or stand aside.
How each of the three RSI lines is calculated
All three lines use the same formula on closing prices. Only N, the number of candles, changes. If your charting platform has no ready-made three-line version, add the ordinary RSI three times to the same panel and set the lengths to 6, 12 and 24; the result is identical. The standard single RSI defaults to period 14 on the close in MT5.
RS  = average gain over N candles ÷ average loss over N candles
RSI = 100 - 100 ÷ (1 + RS)
An illustrative example: over the last 6 candles the average gain is 9 pips and the average loss is 3 pips.
The averages are smoothed, so each new candle counts for 1/N of the result. On the 6 line the latest candle is one sixth of the average. On the 24 line it is one twenty-fourth. That is why one strong candle can throw the 6 line across the panel while the 24 line barely moves.
Reading the fast, middle and slow lines together
Give each line one job:
- RSI 6 (fast line): timing. It reaches 70 and 30 often and turns first.
- RSI 12 (middle line): confirmation. It behaves much like the standard 14 setting.
- RSI 24 (slow line): bias. Above 50 means average gains have outweighed average losses over roughly the last 24 candles, below 50 means the reverse.
The chart below shows the pattern that matters most. The fast line pushes above 70 twice, the middle line barely touches it, and the slow line never gets there. On the pullback the fast line dips below 30 while the slow line holds above 50. Only at the end do all three sit under 50.
Two decision rules follow from this:
- If the fast line is below 30 and the slow line is above 50, treat it as a dip inside an uptrend. Look for buys, not sells.
- If the fast line is above 70 and the slow line is also climbing toward 70, the move is strong. Do not sell just because of the overbought label.
A common misread is treating every crossing of the three lines as a signal. In a flat market they braid together around 50 and cross constantly. Lines bunched between 40 and 60 mean "no information", not "trade".
When the three lines help and when they mislead
Works well:
- Trending markets with clear pullbacks, where the slow line stays on one side of 50.
- Wide ranges, where the fast and middle lines reach 70 and 30 in turn while the slow line swings around 50.
- 1-hour charts and above, where single candles carry less noise. Below 1-hour the fast line is noisy, which is why the scalping row in the style table widens the levels to 80/20.
Avoid or reduce size:
- Tight, quiet ranges where the lines tangle near 50.
- The minutes around major news releases, when one candle drags the fast line to an extreme that means nothing.
- Strong one-way trends if your plan is to fade overbought or oversold readings.
Strengths and limits of the triple-RSI layout
| Pros | Cons |
|---|---|
| Timing and bias in one panel | Three lines clutter a small screen |
| Fast-line spikes are easy to tell from confirmed moves | All three come from the same closes, so they are not independent confirmation |
| Shows pullbacks inside a trend clearly | Fast line gives many false extremes |
| One formula, so nothing new to learn | Slow line turns late after sharp reversals |
Applying the 6-12-24 rules to a real RSI(14) overbought reading
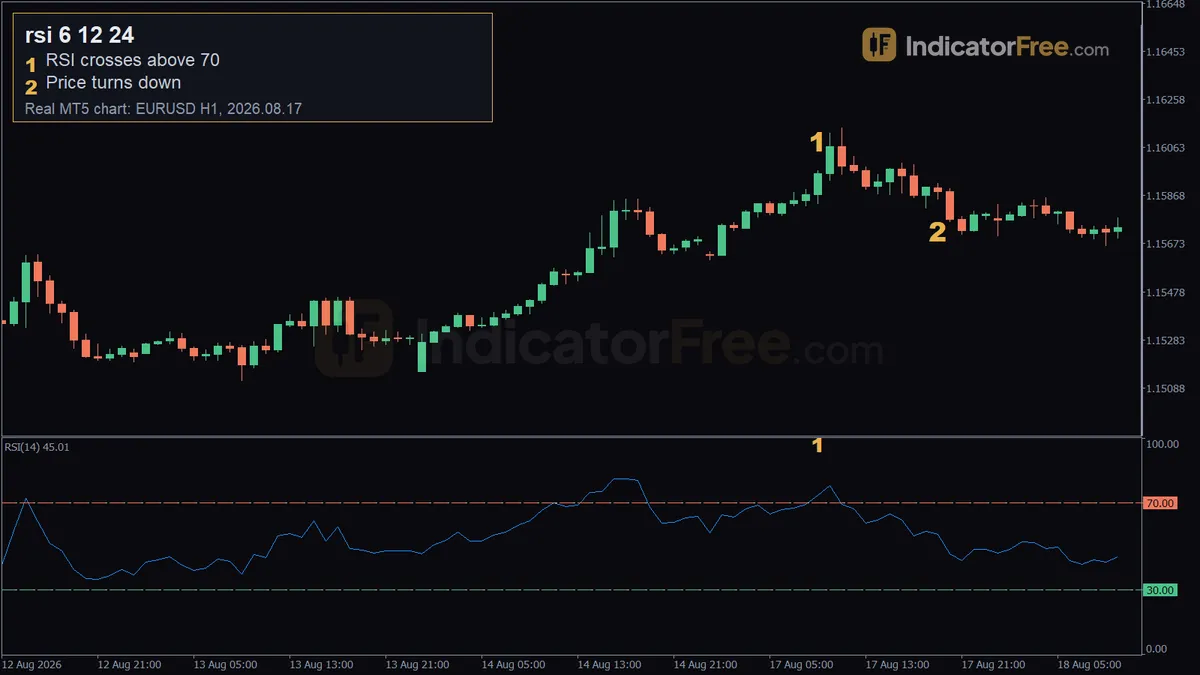
The chart at the top of the page is EURUSD 1-hour on 17 August 2026, with a single RSI(14), which sits between the 12 and 24 lines. It is a past example, not a prediction.
What the chart shows:
- Marker 1, the alert: at 09:00 the RSI(14) crossed above 70 (value 73.6) with price at 1.15968.
- Marker 2, the turn: price turned down at 19:00, ten hourly candles after the cross, at 1.15852.
- The move: price fell 44 pips over the 15 candles after the cross.
The chart does not draw the 6, 12 and 24 lines, so what follows is the rule you would apply in a situation like this, not something marked on the image:
- Entry trigger: a cross above 70, like the one at 09:00 at 1.15968, is the alert, not the entry. Sell only when the fast line drops back under 70 while the middle line has stopped rising. Take this fade only when the slow line is flat near 50 (a range) or has already turned down. If the slow line is still rising above 50, skip the sell and wait for the next fast-line dip to buy.
- Stop loss: above the highest high printed while the lines were overbought. If price makes a new high, the idea is wrong.
- Exit: the target is the fast line reaching 30. If the middle line stalls at 50 before the fast line reaches 30, close, because a middle line that holds at 50 means the down move has lost its confirmation.
Which line to trade from, by trading style
The periods stay at 6, 12 and 24. What changes is which line you act on.
| Style | Timeframe | Trigger line | Bias line | Note |
|---|---|---|---|---|
| Scalping | 5-minute, 15-minute | RSI 6 | RSI 24 | Use 80/20 on the fast line to cut noise |
| Day trading | 1-hour | RSI 6 or 12 | RSI 24 | Trade only in the direction of the slow line versus 50 |
| Swing | 4-hour, daily | RSI 12 | RSI 24 | Fast line is for fine-tuning the entry only |
What the Lab counted for short, medium and long RSI periods
The IndicatorFree Lab counted periods 7, 14 and 21, the closest standard settings to 6, 12 and 24. Expect the 6 and 12 lines to be slightly quicker than these figures, and the 24 line slightly slower. This is past data, not a forecast.
- EURUSD 1-hour (2023-01-02 to 2023-06-08, 2714 candles): RSI(7) moved above 70 22.5 times and below 30 23.1 times per month, spending 13.4% of candles above 70. RSI(21) did each only 3.5 times per month and spent 2.2% of candles above 70.
- EURUSD 4-hour (same dates, 680 candles): RSI(21) moved above 70 just 0.8 times per month.
- XAUUSD 1-hour (2025-10-02 to 2026-10-02, 5917 candles): RSI(7) spent 15.2% of candles above 70 against 11.9% below 30. RSI(21) spent 4.8% above 70 against 2.6% below 30.
The practical reading: a fast-line extreme on a 1-hour chart is an everyday event, while a slow-line extreme is rare. In that gold sample, overbought time outweighed oversold time on every period, so be slower to sell an overbought gold reading.
Quick checklist before you act
- Is the slow line above or below 50? That is your allowed direction.
- Has the fast line reached an extreme against that direction and started to turn back?
- Is the middle line supporting the turn, not still pushing the other way?
- Has price confirmed with a turn candle, a candle that closes back in your direction?
- Is there a clear price level for the stop, and no major news due?
- Is the trade sized from the stop distance, not from how extreme the reading looks?
FAQ
Why 6, 12 and 24 and not 7, 14 and 21?
Each period doubles the previous one, so the three lines are evenly spaced in speed. The 7-14-21 set behaves very similarly. The 6 and 12 lines are slightly quicker, the 24 line slightly slower, and the reading rules do not change.
Does RSI 6 12 24 work on stocks and crypto?
The rules are the same, but markets that gap between sessions, such as stocks, can move the fast line sharply at the open, so give the first candles of the day less weight.
Which of the three lines should I set an alert on?
Set it on the fast line at your extreme level, because it fires first. Then check the slow line by eye before doing anything.