









Bullish order block
Also called Bullish OB, Demand order block, Bullish institutional candle
A bullish order block is the last bearish candle before a strong rally that breaks a recent high. Traders mark that candle's range as a zone where buyers may step in again when price comes back.
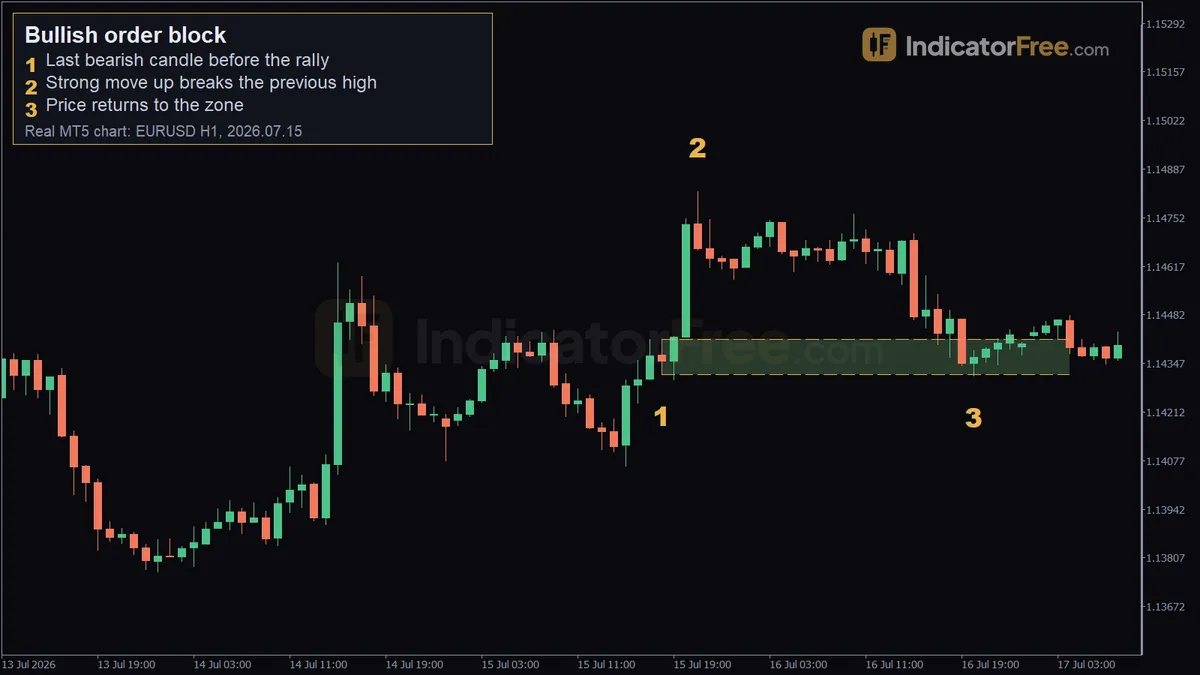
It gives you two prices before you trade. One is where to buy. The other is where the idea is clearly wrong. The second price protects your account, because it sets your stop and the size of your position.
How to spot a bullish order block: 6-step checklist
Work through these steps in order. If any step fails, you have an ordinary down candle, not a bullish order block.
- Find a strong move up. Look for two or more large bullish candles in a row with small wicks. Traders call this burst displacement.
- Check that it broke structure. The rally must close above the most recent swing high, which is a peak with lower highs on both sides. This is a break of structure, and it shows buyers took control.
- Mark the last bearish candle before the move. Go back to the final candle that closed lower than it opened before the rally started. That candle is your order block.
- Draw the zone. Draw a box from that candle's low to its high and extend it to the right.
- Look for an imbalance. A sharp rally often leaves a gap where one candle's high does not reach the low of the candle two bars later. That gap means few sellers got in during the move.
- Confirm the zone is fresh. Price should not have come back to the zone since the rally. Traders prefer the first return, because each later visit may have already used up some of the buy orders waiting there.
Why should the zone hold at all? The usual theory is that large buyers filled big orders around that last down candle, and the sharp rally shows their buying swamped the sellers. Price often runs away before every one of those orders is filled. When price comes back, the buy orders still waiting there can soak up the selling and push price up again. That is the reason traders watch the zone. The zone can still fail, so you always trade it with a stop.
The chart below puts all six steps on one illustrative chart. The box starts at the last down candle. The rally clears the prior high, and price later dips into the box and turns up.
Reading the EURUSD 1-hour bullish order block, marker by marker
The chart at the top of the page is a past EURUSD 1-hour example, not a prediction.
- Marker 1: the last bearish candle (15 July 2026, 18:00, 1.14317). This down candle closed just before buyers took over. Its range sets the zone from 1.14317 to 1.14414, which is about 10 pips tall.
- Marker 2: the break of the previous high (15 July 2026, 21:00, 1.14824). In the three candles after the order block, price cleared the highest high of the previous 10 bars. The marker price, 1.14824, is the high of that breakout move, not the level of the old high. That is steps 1 and 2 of the checklist: displacement, then a break of structure. The three-candle burst itself covered about 35 pips, more than three times the zone's height, so it clears the twice-the-height test in the next section.
- Marker 3: the return to the zone (16 July 2026, 20:00, 1.14312). About a day later, price came back and touched 1.14312. That is half a pip under the zone's low.
Marker 3 carries the main lesson. A stop placed exactly on the zone's low would have been hit by half a pip, just before price turned up. Always leave a buffer below the zone.
What makes a bullish order block weak or broken
A zone can pass the checklist and still be a poor one. Treat it as weak if:
- the rally was slow, with candles overlapping each other, rather than sharp;
- the move away from the zone is less than about twice the zone's height;
- the trend on a higher timeframe, such as the 4-hour or daily chart, still points down;
- this is the second visit to the zone, which makes a weaker trade: halve your size or skip it;
- the zone is so tall that a stop below it is more than you can afford to lose.
A zone is broken when a candle closes below its low. The buyers who defended it are gone or trapped. Delete the zone. Do not keep buying lower. Some traders then watch the old zone as resistance, which is a separate idea called a breaker block.
The most common misread is treating a wick like a close. A wick that pokes a few pips under the zone and snaps back is a test, not a break. Judge only on the candle close of the timeframe you drew the zone on.
Bullish order block trade setups with entry, stop and target
You can trade the same zone in two ways. The first uses a limit order, a pending order to buy at a set price or better that only fills if price comes down to it. The second uses a market order, which buys at the current price, placed after a confirming candle.
Setup 1: limit buy at the top of the zone (past EURUSD example)
- Entry: a buy limit at 1.14414, the top of the zone.
- Stop loss: 5 pips under the zone low (marker 1). The risk is the 9.7-pip zone height plus the 5-pip buffer, 14.7 pips.
- Target: the marker 2 high of 1.14824, which is 1.14824 − 1.14414 = 41 pips above entry. The three-candle burst itself covered about 35 pips; the extra distance comes from measuring from the zone top to the breakout high.
The limit filled as price came down on 16 July. The retest low (marker 3) stayed about 4.5 pips above the stop. The 17-pip rise measured after the touch ended about 7 pips above the entry. So this trade needed more than that first bounce to reach its target. The buffered stop is what kept it alive.
Setup 2: buy after a bullish candle inside the zone (illustrative chart)
- Entry: wait for a candle that dips into the zone and closes higher. On the chart above, the candle marked "Retest, closes up" closes back above the zone. Buy at that close.
- Stop loss: 2 pips under the zone low, 25 pips below the entry.
- Target: the swing high made just after the break, 35 pips above the entry.
Setup 1 gets a better price but can fill on a zone that then breaks. Setup 2 skips some of those failures. The cost is a worse entry, and you miss quick touches that never close up.
Here is how to size Setup 2 in an illustrative example: a $10,000 account risking 1%. On EURUSD, one standard lot of 100,000 units is worth $10 per pip.
The order of the steps matters. The zone sets the stop, the stop sets the lot size, and only then do you check whether the target is worth it. Here you risk $100 against a possible $140 if the target is reached. The stop can be hit first, so the $100 loss is just as real an outcome.
When a bullish order block works best, and when to skip it
It tends to work best when the higher-timeframe trend is up, the zone is fresh, and the break of structure is clean. It also helps when the zone sits in the lower half of the latest swing range. There you buy at a discount to the recent move, not near its top.
Draw the zone on the 4-hour or 1-hour chart, and use a lower timeframe only to time the entry inside it. Favor a zone that overlaps an older support level, because then it has two reasons to hold. If the stop below the zone leaves you with a position too small to be worth taking, pass.
Skip it in a sideways range, where every small swing "breaks" a high and zones pile up. Skip it just before major scheduled news, such as a central bank rate decision, when wicks often run straight through zones. Skip it too when several untested zones sit between the current price and yours.
| Pros | Cons |
|---|---|
| Gives an exact entry area and a clear price where the idea fails | Picking "the last bearish candle" is partly a judgment call |
| Stop sits close, so the target can be several times the risk | Tight stops get clipped by wicks, as the EURUSD example shows |
| Works with limit orders, so you don't need to watch every candle | A limit order can fill on a zone that then breaks |
| Same rules on any timeframe and any market | Many zones are never revisited, so you miss trades |
Bullish vs bearish order block
A bullish order block is the last down candle before a rally that breaks a high. You look to buy when price returns, with the stop below the zone.
A bearish order block is the mirror image: the last up candle before a drop that breaks a low, traded as a sell zone with the stop above. It has its own glossary entry, and so does the general Order block entry.
FAQ
What does bullish mean in trading?
Bullish means you expect prices to rise. A bullish order block is a zone where you expect buyers to show up again, so you look to buy there.
Should I draw the zone from the wick or only the candle body?
The full low-to-high range is the safer default, because the stop goes under the true low. Some traders use the open-to-low part for a tighter zone. That gives a better ratio of reward to risk, but more trades get missed or stopped out.
Can I use bullish order blocks on gold, indices or crypto?
Yes. The rules only need candles, so they apply to any chart. On markets that move more, zones get taller, so check that the stop still fits your risk before you trade.