Breakout Retest Zone
Free MT5 indicator that boxes broken swing levels and arrows the retest candle. Lab: 0 of 190 arrows repainted on EURUSD M15 real ticks.
- Repainted
- 0 / 190
- Signals / week
- ≈ 14.9
- Tested on
- EURUSD M15
- Tested
- 2026-10-05
Overview
Breakout Retest Zone is a free MT5 indicator for the main price chart. It marks the latest swing high and low and notes when a candle closes through one. It then boxes a retest zone around the broken level and prints a Retest Buy or Retest Sell arrow when price comes back and a strong candle closes away from it. In the Lab, 0 of 190 arrows changed after they appeared.
It helps traders who already trade breakouts and want the indicator to flag the pullback entry on a closed candle, so they don't have to watch for it by hand.
What it puts on your chart
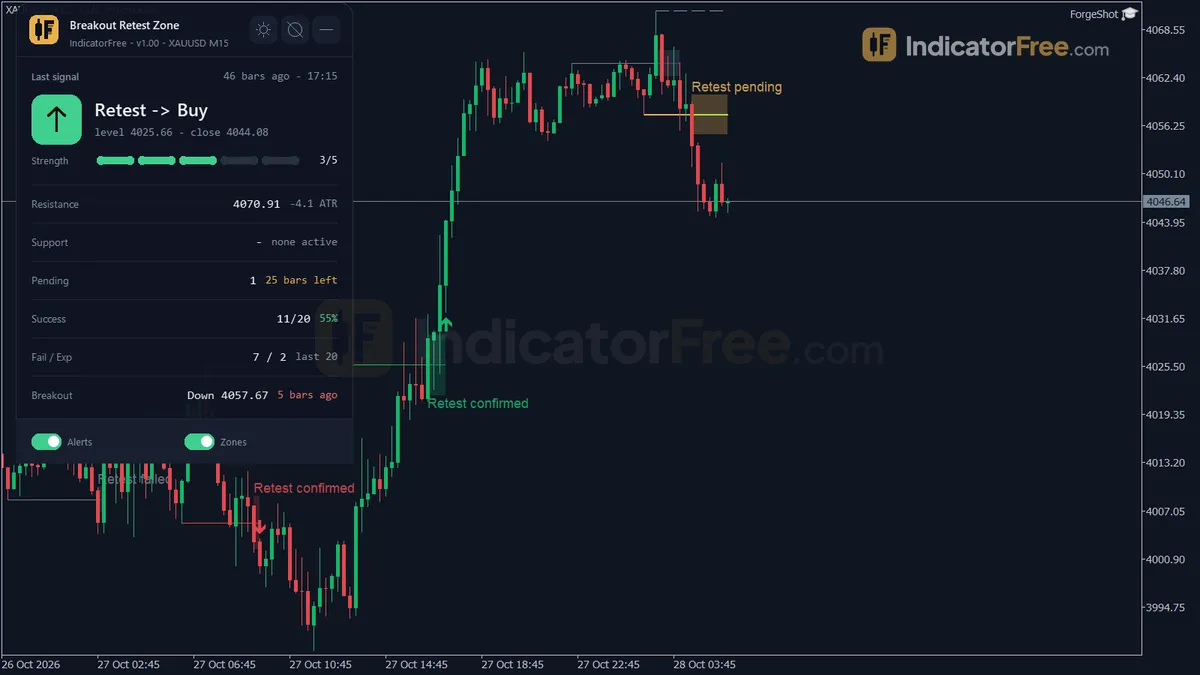
A breakout and retest is the idea that price often comes back to test a broken support or resistance level from the other side before it moves on. This tool automates that one pattern and draws:
- Key Levels: a line on the latest confirmed swing high and swing low. It moves to each newer swing and is removed once the level breaks.
- Retest Zones: a rectangle around the broken level. Its half-width is RetestZoneAtr x ATR, measured at the breakout bar and then fixed, so the box does not stretch when volatility changes later.
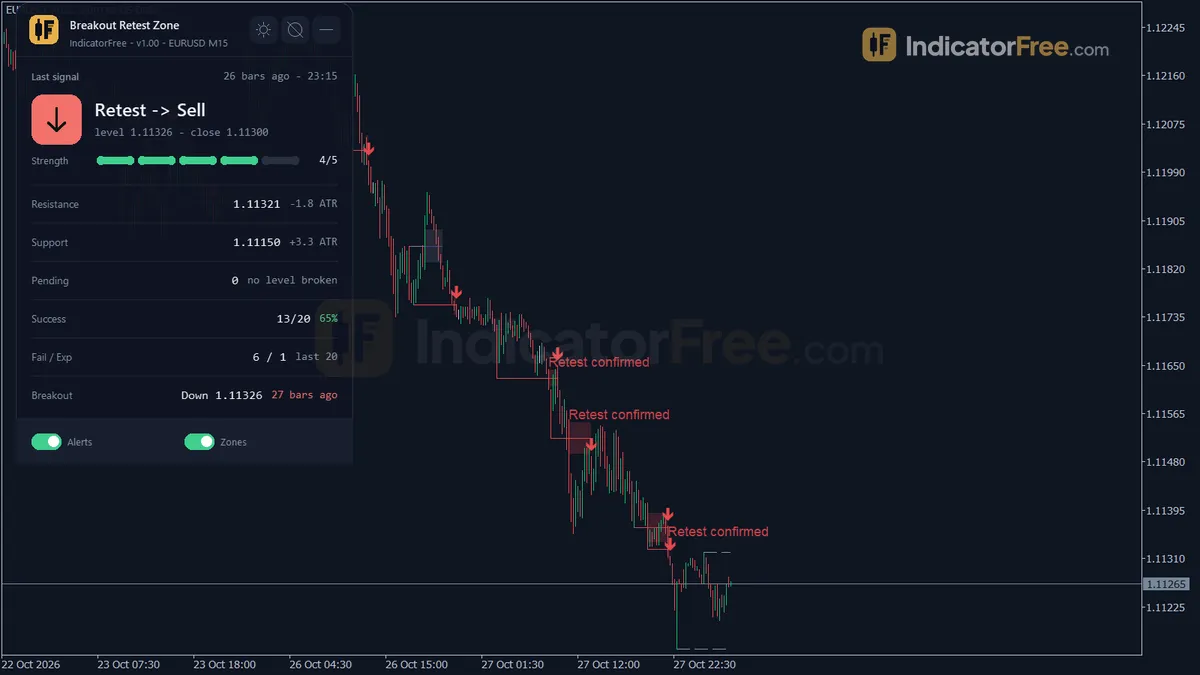
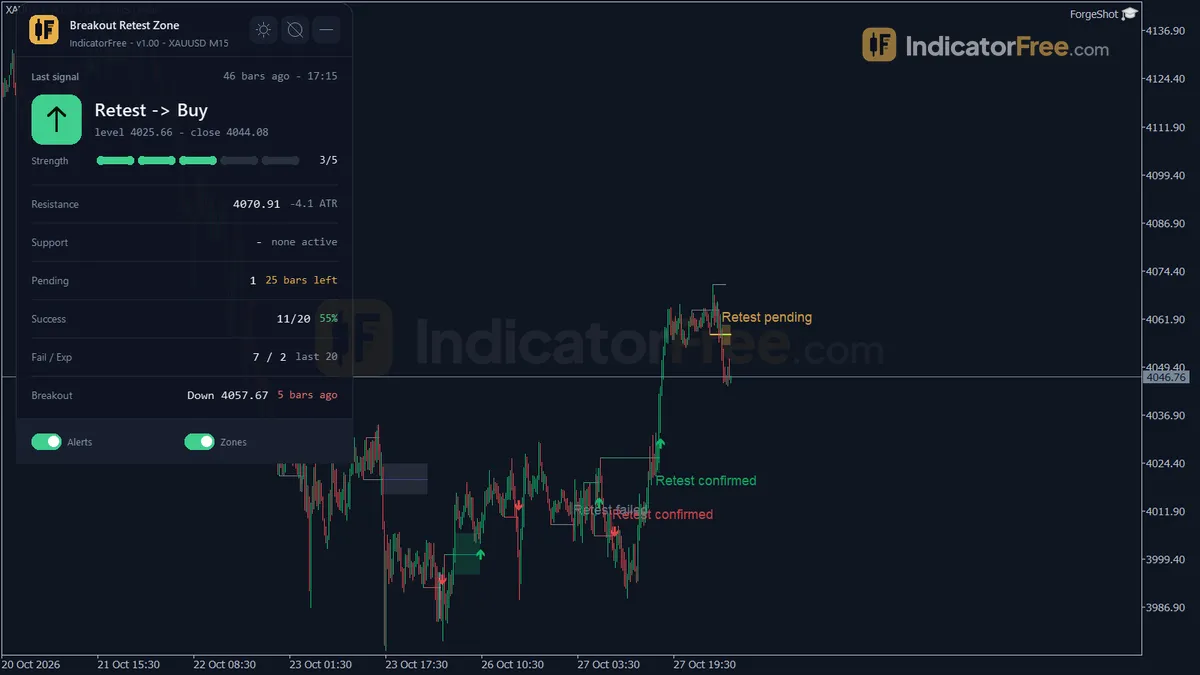
- Retest Status: a label on each zone. A zone closes as confirmed, failed or expired.
- Retest Buy / Retest Sell arrows: on the closed candle that confirms the retest.
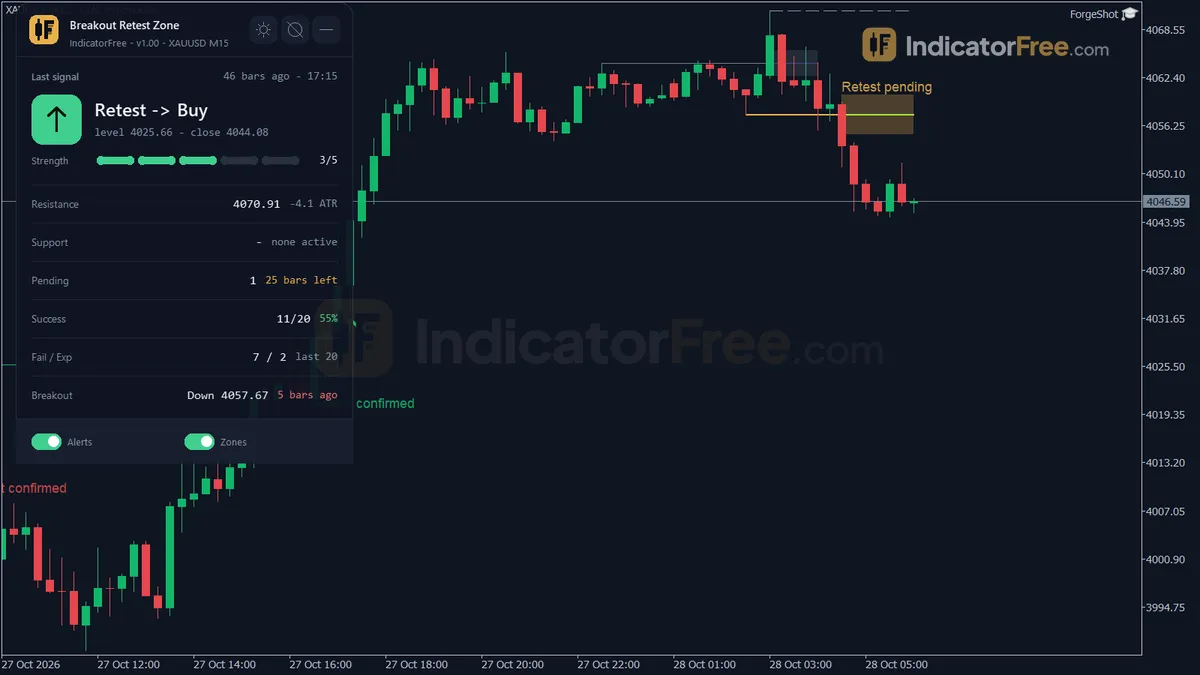
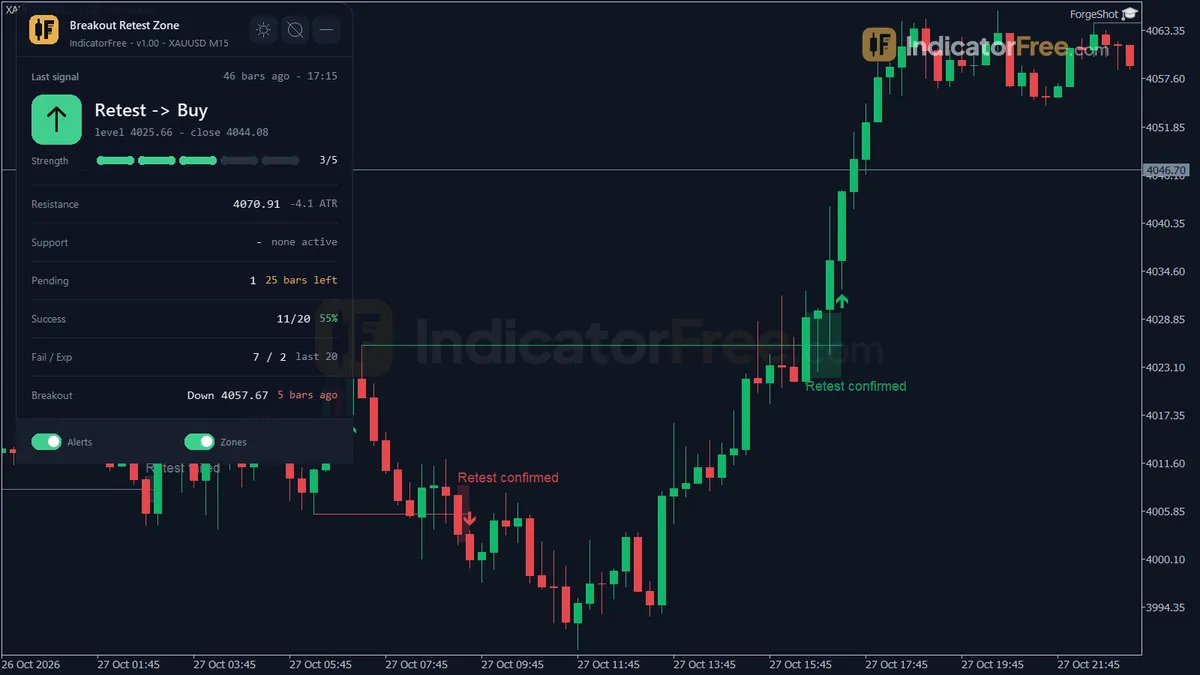
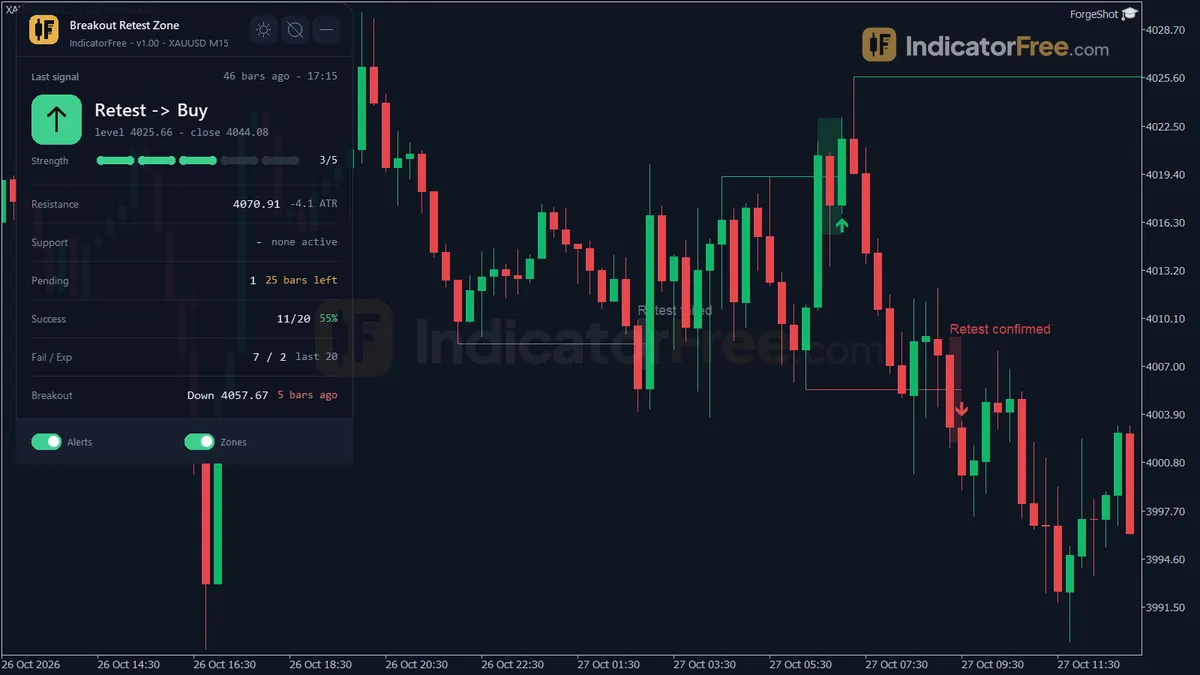
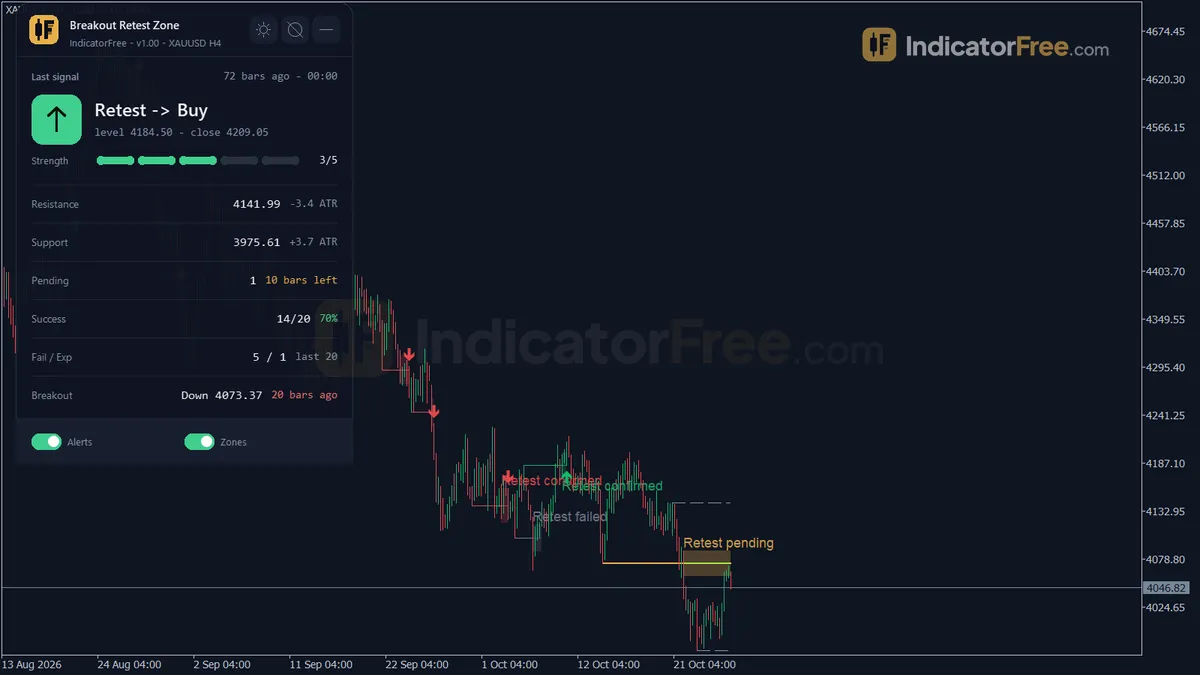
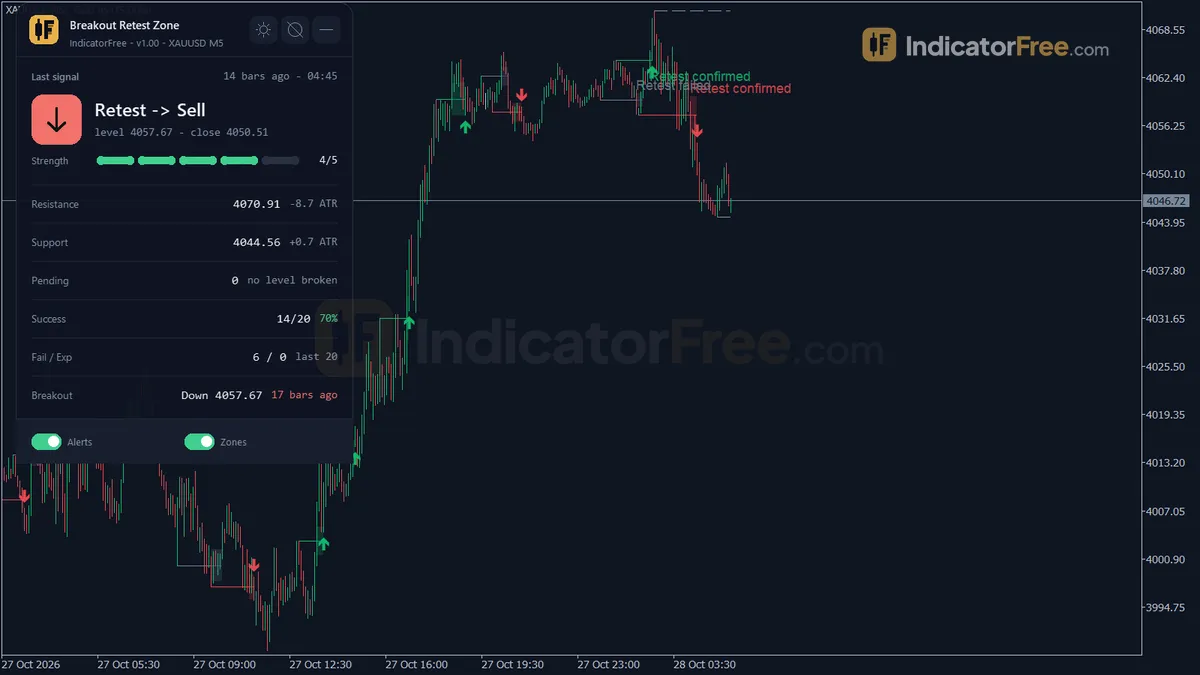
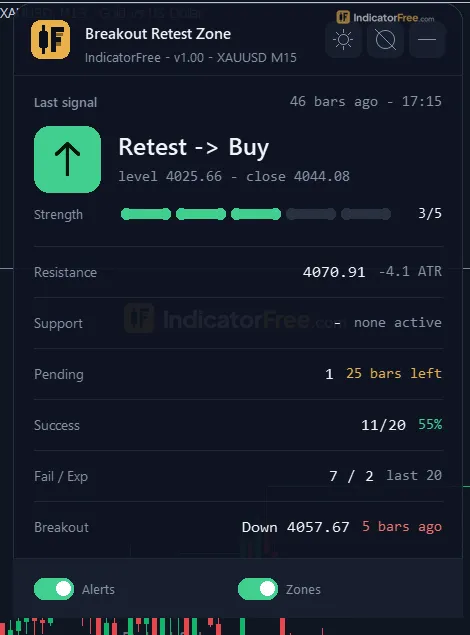
- Retest Stats panel: the last retest signal with its body-ratio strength, the active resistance and support with their distance in ATR, pending retests with bars left, success / failed / expired counts for the last 20 closed levels, and the last breakout.
The chart below shows the shape to look for.
What the Lab measured
The Lab ran version 1.00 on MT5 build 6230 on EURUSD M15 from 2026-07-06 to 2026-10-02, using Raw Trading Ltd real ticks. It logged every arrow as it appeared and checked it again afterwards. The maximum arrow delay was 0 bars: each arrow showed on its own confirmation candle and never appeared later.
For each arrow the Lab then checked one thing: did price move 1 ATR in the arrow's direction before it moved 1 ATR against it?
- 50.8% of arrows reached 1 ATR in their direction first. That is close to a coin flip. The arrow tells you where a retest happened, not which way price goes next.
- Median 2 bars for price to reach one side or the other. On M15 that is about half an hour, so you find out quickly how a signal went.
- Only 1% of arrows reached neither side within 20 bars, so price rarely stalls after an arrow.
- 14.9 signals a week in total: 6.8 Retest Buy and 8.1 Retest Sell.
- Sells reached 1 ATR first slightly more often (53.9% of 103 vs 47.1% of 87). With samples this small the gap may be noise, so treat both sides the same until your own test says otherwise.
Who it is for
Traders who already have a breakout plan with their own stop and target method, and who want each retest flagged on a closed candle, with an alert.
How it works
- 1Detects swing highs and lows using bars on each side of a pivot, keeping the latest as resistance and support.
Pivot High: High above PivotLeftBars before and PivotRightBars afterInputs: PivotLeftBars, PivotRightBars - 2Records a breakout when a candle closes beyond the level by a buffer, then waits for a retest.
Breakout up: Close > Resistance + BreakoutAtrMult x ATR and bullishInputs: AtrPeriod, BreakoutAtrMult - 3A retest is registered when price trades back into a zone around the broken level.
Zone half-width = RetestZoneAtr x ATR at the breakoutInputs: RetestZoneAtr - 4Signals buy or sell when, after the touch, a strong-body candle closes away from the level, passing optional filters.
Body ratio = abs(Close - Open) / (High - Low) >= BodyRatioMin | Close > Level + bufferInputs: BodyRatioMin, UseVolumeFilter, VolumeMult, AlignWithHtfTrend, HtfTimeframe, HtfEmaPeriod - 5The level fails if price closes too far back through it, and expires after the maximum number of bars.
Fail: Close < Level - RetestInvalidateAtr x ATR | expire after RetestMaxBarsInputs: RetestInvalidateAtr, RetestMaxBars
Specifications
- Platform
- MetaTrader 5
- Version
- 1.00
- Type
- Indicator
- Window
- Main chart
- Draws
- 2 arrows, 3 zones, 1 panel
- Alerts
- popup, push, sound
- Repaints
- No (0 of 190 signals changed)
- Inputs
- 24
- Tested on
- MT5 build 6230 · 2026-10-05
Repaint test
No repaint detected. In a 6 Jul 2026 – 2 Oct 2026 test on EURUSD M15 (Raw Trading Ltd real ticks), 190 signals were logged at bar close and re-read at the end of the test: 0 changed. Arrows print on the bar that closes the signal, with no delay.
IndicatorFree — tested 2026-10-05 · MT5 build 6230 · Raw Trading Ltd real ticks. Results come from historical data, not live trading, and do not guarantee future results.
Signal statistics
Over 6 Jul 2026 – 2 Oct 2026 on EURUSD M15, the indicator printed 190 arrows. After 50.8% of them, price moved 1×ATR(14) in the arrow's direction before moving 1×ATR against it (median 2 bars). 1% reached neither level within 20 bars.
This measures price movement after the arrow, not a trading result. It includes no spread, commission, stop loss or position sizing.
What it draws
- Arrows (Retest Buy) from buffer 0, drawn on the closed bar.
- Arrows (Retest Sell) from buffer 1, drawn on the closed bar.
- Rectangles (Key Levels) drawn as chart objects, not buffers — they are not readable by iCustom() in an EA.
- Rectangles (Retest Zones) drawn as chart objects, not buffers — they are not readable by iCustom() in an EA.
- Rectangles (Retest Status) drawn as chart objects, not buffers — they are not readable by iCustom() in an EA.
- An on-chart panel (Retest Stats); values shown in the panel are not exposed as buffers.
Inputs
| Input | Default | What it does |
|---|---|---|
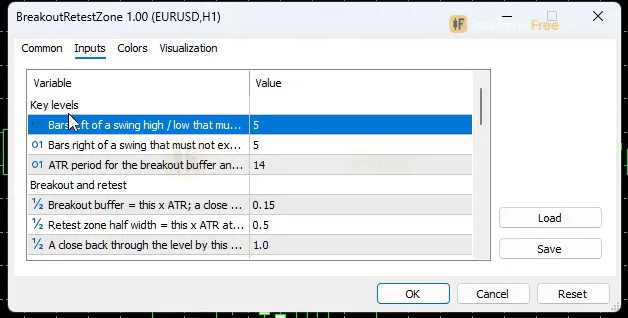
| PivotLeftBars | 5 | Bars left of a swing high / low that must not exceed it (2-20) |
| PivotRightBars | 5 | Bars right of a swing that must not exceed it = confirmation lag (2-20) |
| AtrPeriod | 14 | ATR period for the breakout buffer and the retest zone (5-50) |
| BreakoutAtrMult | 0.15 | Breakout buffer = this x ATR; a close must clear the level by it (0.0-1.0) |
| RetestZoneAtr | 0.5 | Retest zone half width = this x ATR at the breakout bar (0.1-2.0) |
| RetestInvalidateAtr | 1 | A close back through the level by this x ATR marks the retest failed (0.3-3.0) |
| RetestMaxBars | 30 | Bars after the breakout to wait for a confirmed retest before it expires (5-200) |
| BodyRatioMin | 0.4 | Minimum body / range ratio of the confirmation candle (0.0-1.0) |
| AlignWithHtfTrend | false | Only confirm retests that do not go against the higher timeframe EMA slope |
| HtfTimeframe | CURRENT | Higher timeframe for the EMA (Current = H4 on charts up to H1, else D1) |
| HtfEmaPeriod | 50 | EMA period on the higher timeframe (10-200) |
| UseVolumeFilter | false | Require tick volume above the 20-bar average on the confirmation candle |
| VolumeMult | 1.2 | Confirmation tick volume must be at least this x the 20-bar average (1.0-5.0) |
| MaxZonesToKeep | 15 | Max retest zones on the chart; the oldest closed zone is deleted first (3-50) |
| EnableAlerts | true | Master switch for all alerts |
| AlertOnBreakout | false | Alert when a level is broken (before any retest) |
| AlertOnConfirm | true | Alert when a retest is confirmed (arrow) |
| AlertPopup | true | Use popup alerts in the terminal |
| AlertPush | false | Use push notifications to the phone |
| AlertSound | true | Play a sound |
| ShowDashboard | true | Show the status panel |
| PanelScale | 1 | Panel size multiplier (DPI is applied automatically) |
| Theme | Dark | Chart color theme |
| RestoreTheme | true | Restore the original chart colors when the indicator is removed |
How to read it
Install
Copy the indicator file (153.5 KB) into your terminal's MQL5\Indicators folder, refresh the Navigator and drag Breakout Retest Zone onto a chart.
How one signal forms
Every arrow passes the same steps. The flow below shows the buy side; Retest Sell is the mirror image on a swing low.
- 1Swing high confirmedHigh above the PivotLeftBars bars before it and the PivotRightBars bars after it; drawn as the active Key Level
- 2Breakout closeBullish bar closes above the level by BreakoutAtrMult x ATR; the zone is fixed at RetestZoneAtr x ATR either side of the level
- 3TouchA later bar's low trades inside the zone
- 4Confirmation candleClosed bullish bar within RetestMaxBars of the breakout, close above level + buffer, body ratio at least BodyRatioMin, optional trend and vo
- 5Arrow, or the zone closesRetest Buy prints. Otherwise the zone fails on a close RetestInvalidateAtr x ATR back through the level, or expires
Reading the zones, labels and panel
- Open zone: a breakout that is waiting for its retest. The panel lists it under pending retests with the bars it has left.
- Confirmed: the retest passed every check and the arrow printed.
- Failed: a candle closed back through the level by RetestInvalidateAtr x ATR.
- Expired: no confirmation came within RetestMaxBars bars.
- The panel's success / failed / expired counts for the last 20 closed levels show how retests are behaving on this chart right now.
The common misread
The arrow is not the breakout, and it is not always the touch either. The touch can happen on an earlier candle. The arrow comes on the first later candle that closes back away from the level with enough body. So the arrow candle can sit entirely outside the box and look as if price never retested. Check the bars just before it to find the touch. The breakout candle never gets an arrow of its own.
Inputs to change first
The defaults are the settings the Lab tested.
- RetestZoneAtr (0.5, range 0.1-2.0): the main input for both arrows. A wider zone counts more pullbacks as touches, which gives more and looser retests. A narrower zone keeps only tight retests.
- BreakoutAtrMult (0.15): how far a close must clear the level. It applies to both the breakout and the confirmation candle. Raise it to ignore candles that only just poke through.
- BodyRatioMin (0.4): raise it to demand a more decisive confirmation candle. At 0.0 any body size passes.
- RetestMaxBars (30) and RetestInvalidateAtr (1): how long a retest may take, and how far price may push back through the level, before the zone closes as expired or failed.
- AlignWithHtfTrend (off): when on, the indicator itself drops retests that go against the higher-timeframe EMA slope. Set the EMA with HtfEmaPeriod (50) and HtfTimeframe (Current = H4 on charts up to H1, otherwise D1). You don't need to check the EMA yourself.
- UseVolumeFilter (off) with VolumeMult (1.2): the confirmation candle must have tick volume of at least VolumeMult x its 20-bar average.
- PivotLeftBars / PivotRightBars (5 / 5): larger values give fewer, more important swing levels.
- MaxZonesToKeep (15): the most zones kept on the chart. The oldest closed zone is deleted first.
Alerts
EnableAlerts is the master switch. By default you get a popup in the terminal and a sound when a retest is confirmed (AlertOnConfirm). Turn on AlertOnBreakout to also get an alert at the breakout, before any retest. Turn on AlertPush to send alerts to the MT5 app on your phone.
A decision rule
Take a Retest Buy or Retest Sell only when both of these are true:
- AlignWithHtfTrend is on, or you have your own trend reason for the trade.
- The panel shows no opposite level, or shows it at least 1 ATR away (active resistance for a buy, active support for a sell). That leaves room for a 1 ATR move.
Skip arrows while the panel's last-20 counts show more failed zones than successful ones. This rule is a starting point the Lab has not tested, so check it on your own history.
Installation
- 1Download BreakoutRetestZone.ex5 from the button above (Google Drive).
- 2In MetaTrader 5: File → Open Data Folder → MQL5 → Indicators. Copy BreakoutRetestZone.ex5 there.
- 3Restart MT5 or right-click Indicators in Navigator → Refresh.
- 4Drag Breakout Retest Zone onto a chart. For push alerts, enable "Allow push notifications" under Tools → Options → Notifications.
- Tested on MT5 build 6230.
Key terms and guides
- False breakout
- A false breakout is when price closes beyond support, resistance or a range edge, fails to hold there, and closes back on the original side, often followed by a move the other way.
- Breakout retest
- A breakout retest is when price breaks through a support or resistance level, then comes back to touch that level from the other side and holds. Traders use the retest as a calmer entry than the breakout candle itself.
- Triangle breakout
- A triangle breakout is when price closes outside a triangle chart pattern. In that pattern, two trendlines move closer together and squeeze price into a narrower range. The break suggests the pause is ending and a new move may start.
- Breakout confirmation
- Breakout confirmation is the evidence you wait for before you trust a breakout. It usually means a candle closing beyond a support, resistance or range edge, and price staying outside the level afterwards.
- Swing High/Low
- A swing high is a candle whose high sits above the highs of the candles on both sides of it. A swing low is a candle whose low sits below the lows on both sides. Together they mark the turning points of price.
- Pullback
- A pullback is a short, temporary move against the main trend: price dips during an uptrend or rallies during a downtrend, then turns back the trend's way. Traders use it to enter a trend at a better price.
- Guide: Types of Pending Orders in Forex Trading: Limit, Stop and Stop Limit
- Guide: What Is an Expert Advisor? How an EA Trades Forex for You
More on this subject: Supply, demand & key levels guide, terms and tools
User reviews
No reviews yet. Members who download the tool can review it here.
Sign in and download the tool to review it.
Build a checklist with it
Breakout Retest Zone does one job on the chart: zone / level. Put it on the same chart as the tools below and the IndicatorFree panels merge into one checklist card, ordered trend, zone, signal, risk.
- Trend / contextDMIAdds the trend side: which way the market leans before you act on Breakout Retest Zone.
- Entry signalBox BreakoutAdds the entry signal: the moment to act once Breakout Retest Zone has set the scene.
The Lab has not tested these combinations. Each tool is tested on its own; the card only lines up what each one says. Free members get 2 new tools a day. If one has to wait until tomorrow, install BlackBox to raise the limit to 5 a day (20 on a live account).
FAQ
Does Breakout Retest Zone repaint?
No repaint detected. In a 6 Jul 2026 – 2 Oct 2026 test on EURUSD M15 (Raw Trading Ltd real ticks), 190 signals were logged at bar close and re-read at the end of the test: 0 changed. Arrows print on the bar that closes the signal, with no delay.
Can I use Breakout Retest Zone in an EA?
Yes. Read buffer 0 (Retest Buy) with iCustom() on bar 1 — the last closed bar.
Why can’t my EA read the zones?
Zones and the panel are chart objects, not indicator buffers, so iCustom() does not return them.
How do I get alerts on my phone?
Enter your MetaQuotes ID under Tools → Options → Notifications, tick "Enable push notifications", and keep the push alert input on.
Does it work on other pairs?
Tested on EURUSD only; other symbols not tested.
Does it work on other pairs and timeframes?
It runs on any MT5 chart. The Lab numbers come from the single test described under What the Lab measured, so check anything else on your own history first.
Why does the swing line appear a few candles after the swing?
A swing counts only after PivotRightBars candles have closed without going beyond it. With the default of 5, the line appears 5 bars late. Lowering it (minimum 2) draws lines sooner, but you get more minor swings.
How do I get alerts on my phone?
Set AlertPush to true and enter your MetaQuotes ID in the terminal's notification settings. Alerts then go to the MT5 mobile app as well as the popup and sound.
Why did my chart colors change?
The Theme input (Dark by default) recolors the chart. With RestoreTheme left on, your original colors come back when you remove the indicator.
Why did older zones disappear from the chart?
MaxZonesToKeep (default 15) limits how many zones stay on screen. The oldest closed zone and its label are deleted first. Raise it to 50 if you want to keep more history.
Changelog
- 1.00Initial release: fractal-confirmed swing levels, ATR breakout buffer, frozen ATR retest zone, four-condition bounce confirmation (zone touch, buffer close-through, directional candle, minimum body ratio),. · 2026-10-09
Final verdict
The verdict
This is a clean location tool. Its strength is that the drawing can be trusted: arrows did not repaint or arrive late in the Lab test, so what you see in history is what you would have seen live. The fixed zone and the status label also let you check every retest after the fact. Its weakness is the hit-rate result: the arrow alone showed no directional edge. It earns its place only with your own filter and exit plan.
Where it falls short
- It gives no stop-loss, take-profit or position size.
- The Lab measured one symbol and one timeframe, EURUSD M15. The screenshots show it on H4 and M5, but those charts were not measured.
- It takes levels from swing pivots only. It ignores round numbers, prior-day highs and lows, and session levels.
- Arrows print only after the candle closes, so there is no early entry.
Use the comparison below to decide whether it fits how you trade.
- –You already trade breakouts and want the pullback flagged on a closed candle
- –You bring your own stop, target and trend filter
- –You want a history you can check, with arrows that stay where they printed
- –You want a stand-alone system that wins on its arrows alone
- –You need an entry before the candle closes
- –Your levels are round numbers or session highs rather than swing points
Settings to start with
Start on the defaults, because they are what the Lab tested. Then try these untested starting points and compare each one with the default on your own history:
- On M5, try BreakoutAtrMult 0.25 to drop marginal breakouts.
- On H4, try RetestMaxBars 15, so a retest has to arrive within about 2.5 days.
- On any timeframe, try AlignWithHtfTrend set to true.
None of these values were tested by the Lab.
A tool to pair it with
Key Level Map covers levels this tool ignores: prior day and week highs and lows and round numbers, each scored 0-100. Together they show whether a retest arrow is firing straight into a stronger level. This is an idea to try; the Lab has not tested the pair.