









Volume & order flow
- Indicators
- 3
- Expert Advisors
- 0
- Downloads
- 1
3 tools
| # | Tool | Type | Platform | Test result | Signals / week | Downloads | Released | |
|---|---|---|---|---|---|---|---|---|
| 1 | 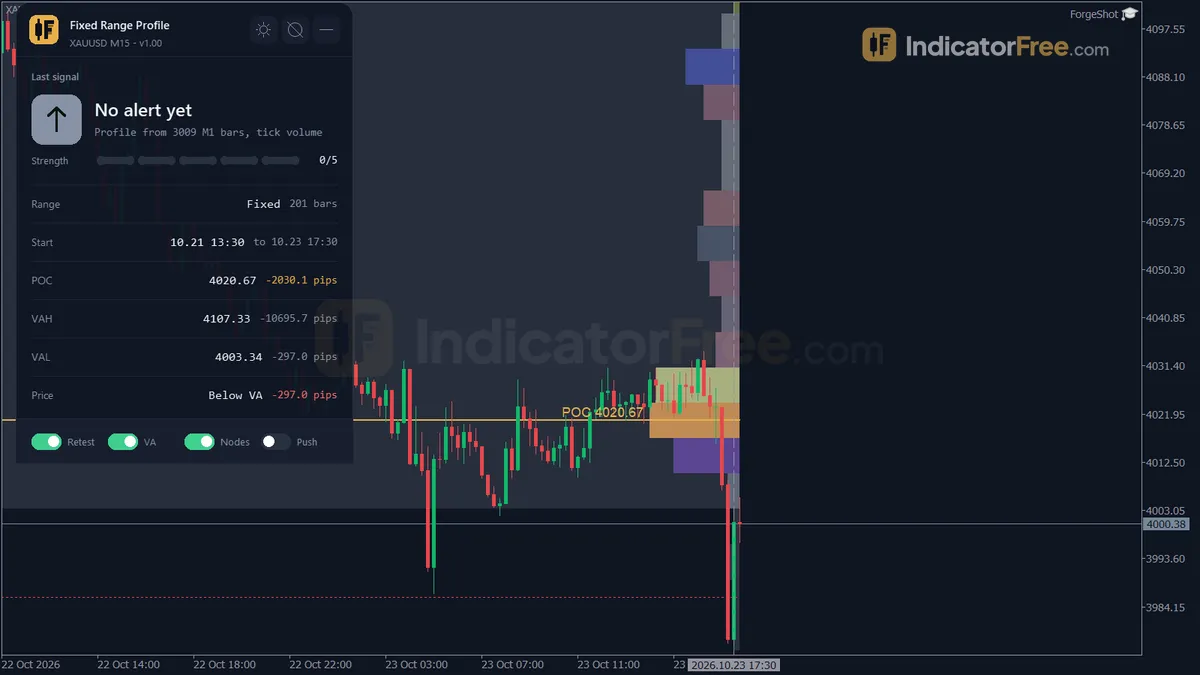 Fixed Range ProfileVolume & order flow | Indicator | MT5 | Not tested | — | 0 | 4 days ago | Get it |
| 2 | 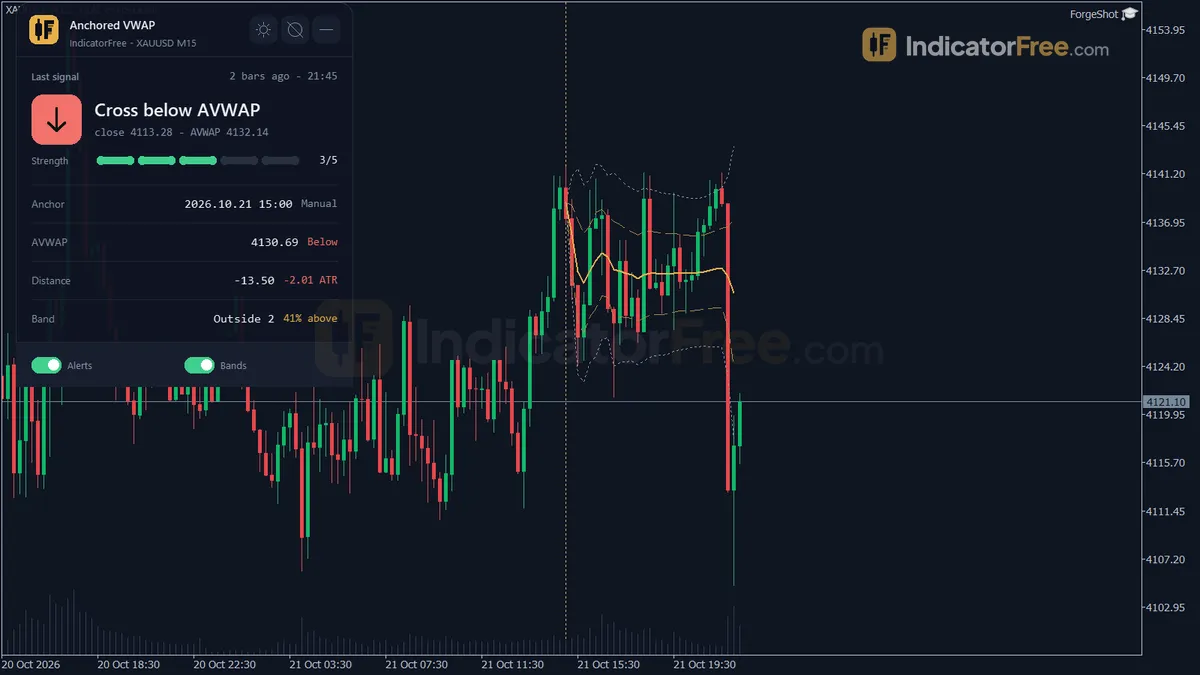 Anchored VWAPVolume & order flow | Indicator | MT5 | Not tested | — | 0 | 23 days ago | Get it |
| 3 | 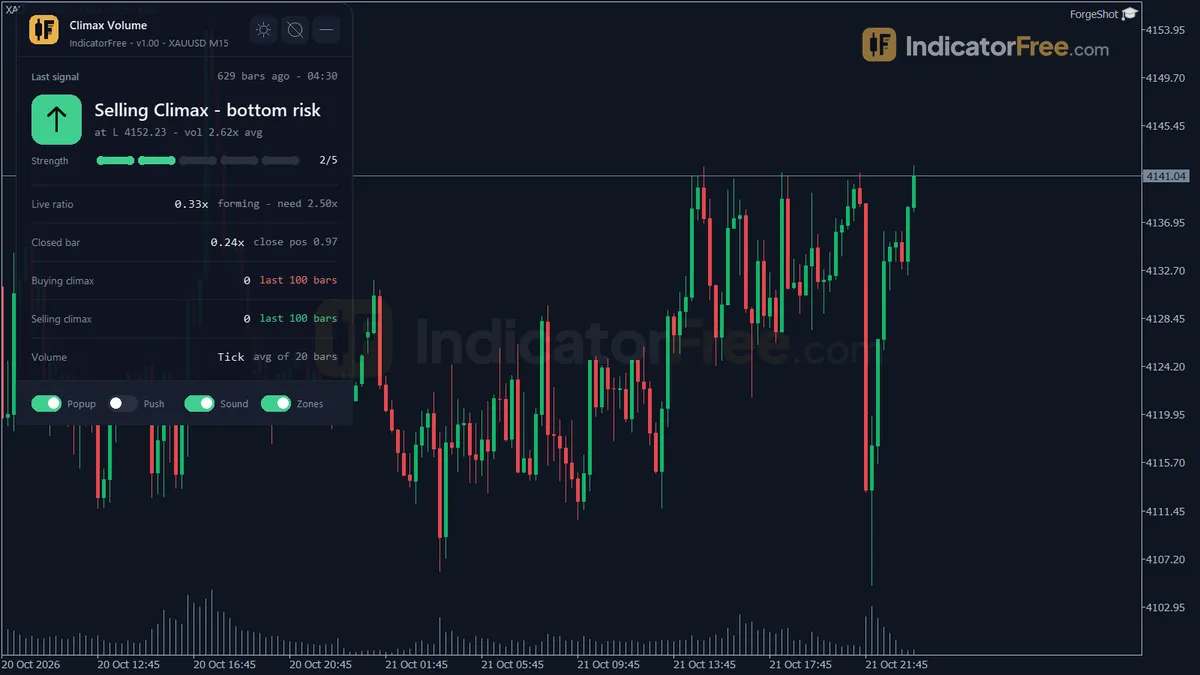 Climax VolumeVolume & order flow | Indicator | MT5 | No repaint | 1 | 1 | 23 days ago | Get it |
Volume indicators show how much trading activity sits behind price moves. Tick volume bars, VWAP, anchored VWAP, volume profile, delta and money flow tools all try to answer one question: did many participants take part in this move, or only a few? That helps you separate moves with weight behind them from thin drifts, and it marks price levels where the market spent real effort.
Tick volume: what forex and gold volume really counts
Spot forex has no central exchange, so there is no single total volume figure. What your platform shows is tick volume: the number of price changes in each bar.
More ticks usually means more activity, so it is a fair proxy. But it is your broker's feed, not the whole market.
So compare volume with its own recent history on the same chart, never raw numbers between brokers, symbols or timeframes.
"Delta" and "order flow" tools on forex symbols are estimates. They usually call each tick buying or selling by whether price moved up or down: a useful approximation, not a view of real orders.
VWAP, volume profile or climax bars: which question each answers
| Tool | Question it answers | Useful for | Main limit |
|---|---|---|---|
| Tick volume / climax bars | Was this bar unusually active? | Spotting exhaustion or strong starts | Broker feed only |
| VWAP (session) | What is the average price traded today, weighted by activity? | Intraday fair value, bias above or below | Resets each session |
| Anchored VWAP | What is the average price since a chosen event? | Tracking buyers or sellers since a swing or news bar | Depends on where you anchor |
| Volume profile | At which prices did most activity happen? | Finding high-activity and thin zones | Needs enough bars |
| Delta / money flow | Is activity leaning to buyers or sellers? | Spotting divergence from price | Estimated on forex data |
If you trade intraday, start with session VWAP. If you swing trade, an anchored VWAP from a major swing low or high is often more relevant. If you want levels, use a volume profile.
Exhaustion or ignition: read a climax bar by its location
A climax bar is a candle with volume far above its recent average, often two or three times higher. Climax tools highlight these bars for you.
The common misreading is treating every climax bar as a reversal. A high-volume bar can mean two opposite things:
- At the end of a long move, with a long wick and price failing to follow through, it often marks exhaustion.
- At the start of a move out of a range, with a strong close near the high or low, it often marks the start of real participation.
Ask where the bar appeared before you ask what it means.
Anchor VWAP to a gold swing low and watch it hold
Anchored VWAP shows the average price paid by everyone who traded since a point you choose.
Example: Gold makes a clear swing low at 2,300 after a news release. You anchor VWAP to that bar. Over the next week, price climbs to 2,360. The anchored VWAP rises slowly behind it and now sits at 2,330. Price then pulls back to 2,332 and holds above the line for three H1 closes.
Buyers who entered since the low are, on average, still in profit. As long as price holds above 2,330, that group has little reason to sell. A clean close below the line would mean the average buyer since the low is now losing, which often leads to more selling.
This reads positioning, not a signal. You still need a stop beyond the level and a reason to enter.
Check breakout participation with tick volume
Volume adds weight to signals from other tools. On its own it rarely tells you where to enter. If/then rules to test:
- If price breaks a range and tick volume on the breakout bar is at least 1.5 times its 20-bar average, then the break has more participation than a quiet drift. The breakout indicators group pairs well here.
- If price makes a new high but volume and money flow are falling, then the push is weakening; tighten your stop rather than add.
- If a supply and demand zone lines up with a high-activity area on the volume profile, then that zone carries more weight than one sitting in a thin area.
The current bar's volume grows until it closes, so judge volume on closed bars only. Quiet sessions, such as the late US afternoon, usually show lower ticks.
Four questions before you trust a volume reading
- Am I comparing this bar with its own recent average, not an absolute number?
- Is the time of day normal, or is this a session open or news bar?
- Does the location (range edge, trend end, key level) support my reading?
- Do I have a separate entry trigger and a stop?
To start, install a VWAP and a climax volume tool with the installation guide, add them to one H1 chart on demo, and note what happened after the last ten climax bars.