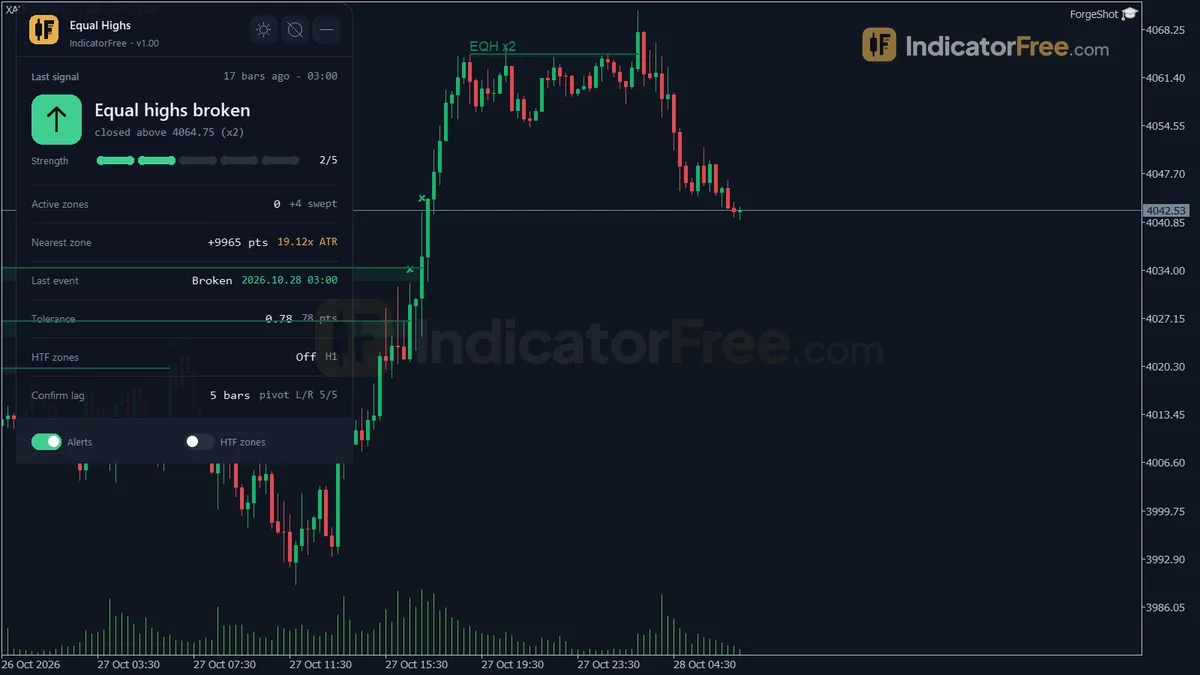
Equal Highs
Free Equal Highs indicator MT5: boxes equal-high liquidity zones, arrows sweeps and closes above them. Lab repaint test: 0 of 125 signals changed.
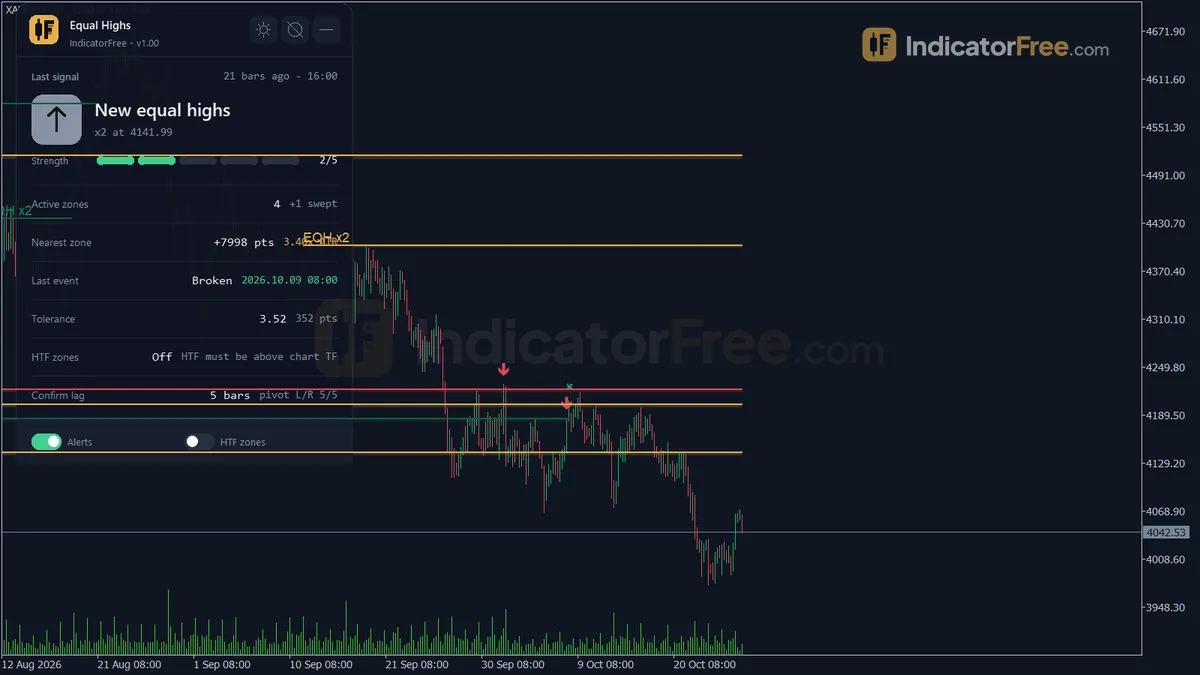
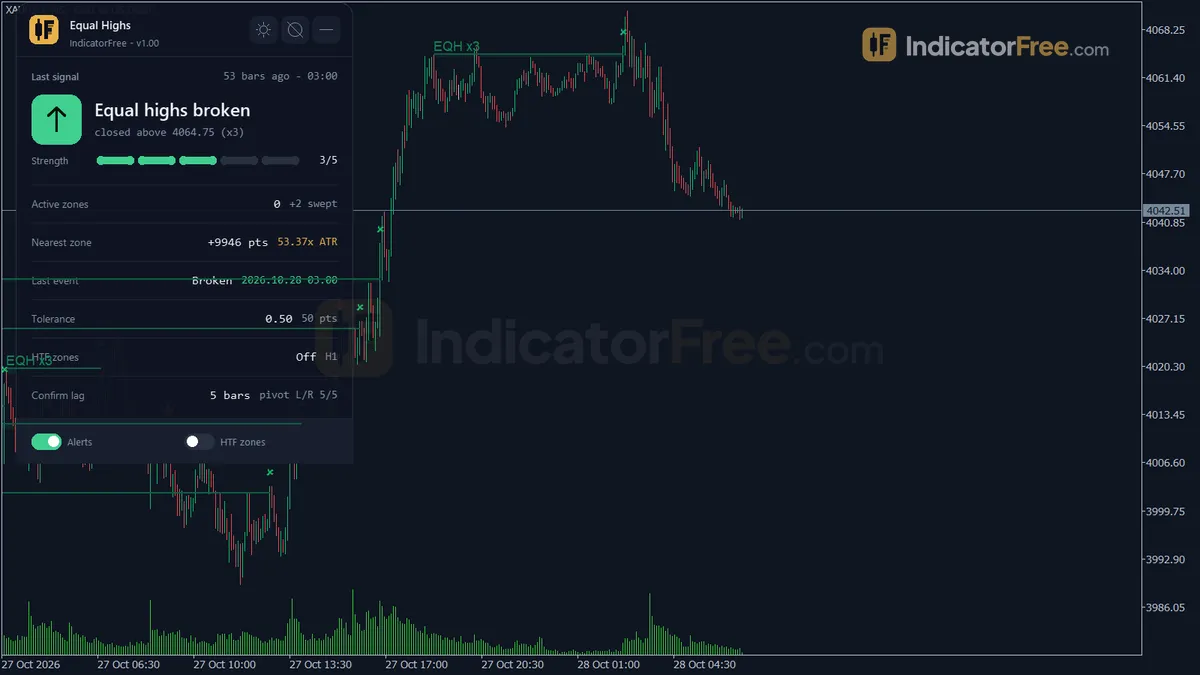
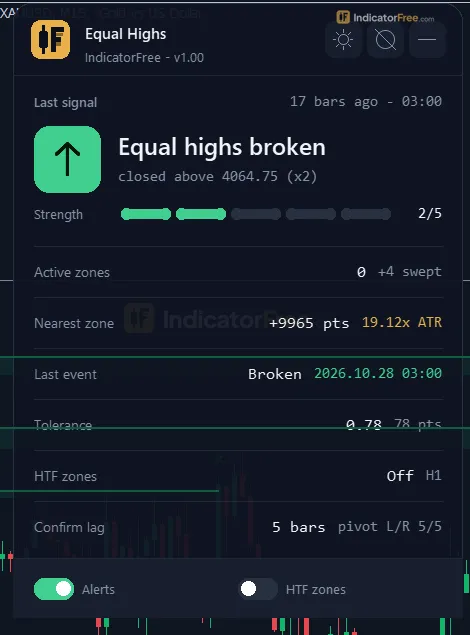
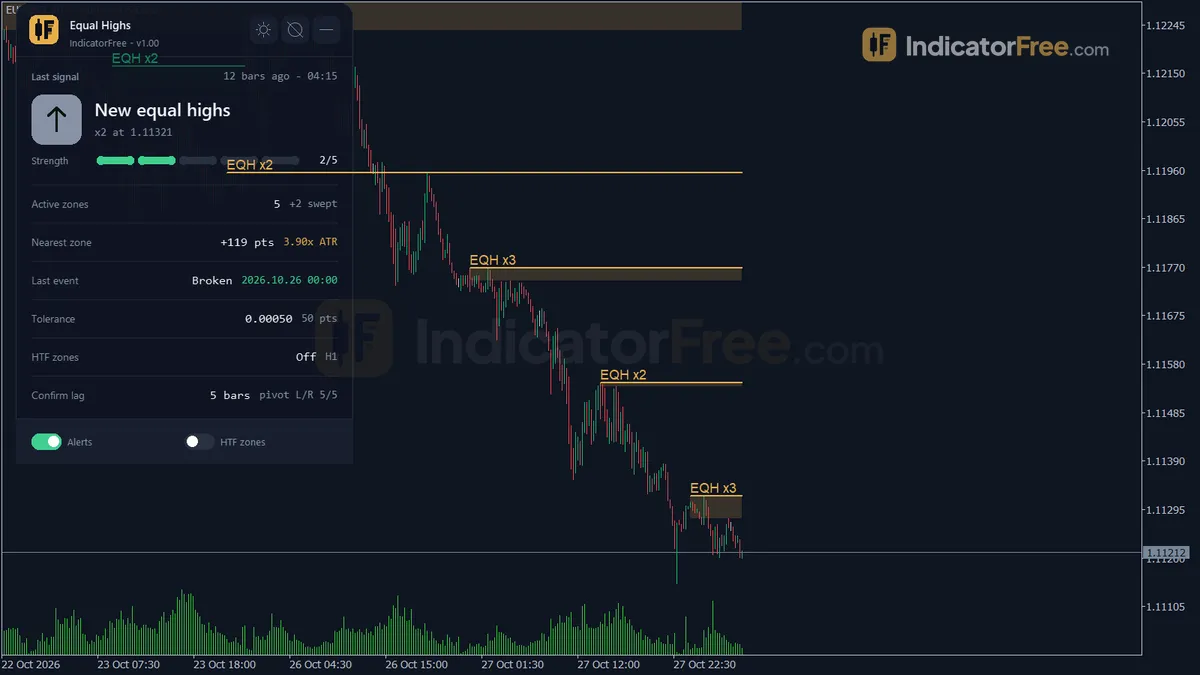
- Repainted
- 0 / 125
- Signals / week
- ≈ 9.8
- Tested on
- EURUSD M15
- Tested
- 2026-10-04
Overview
Equal Highs is a free MT5 indicator that draws a box around groups of matching swing highs on your main chart. It suits traders who already plan around liquidity and want these zones drawn and their sweeps flagged without watching every candle. In the Lab's repaint test, 0 of 125 arrows changed after they appeared. Sweep arrows reached 1 ATR in their direction first 61.9% of the time (42 signals, EURUSD M15).
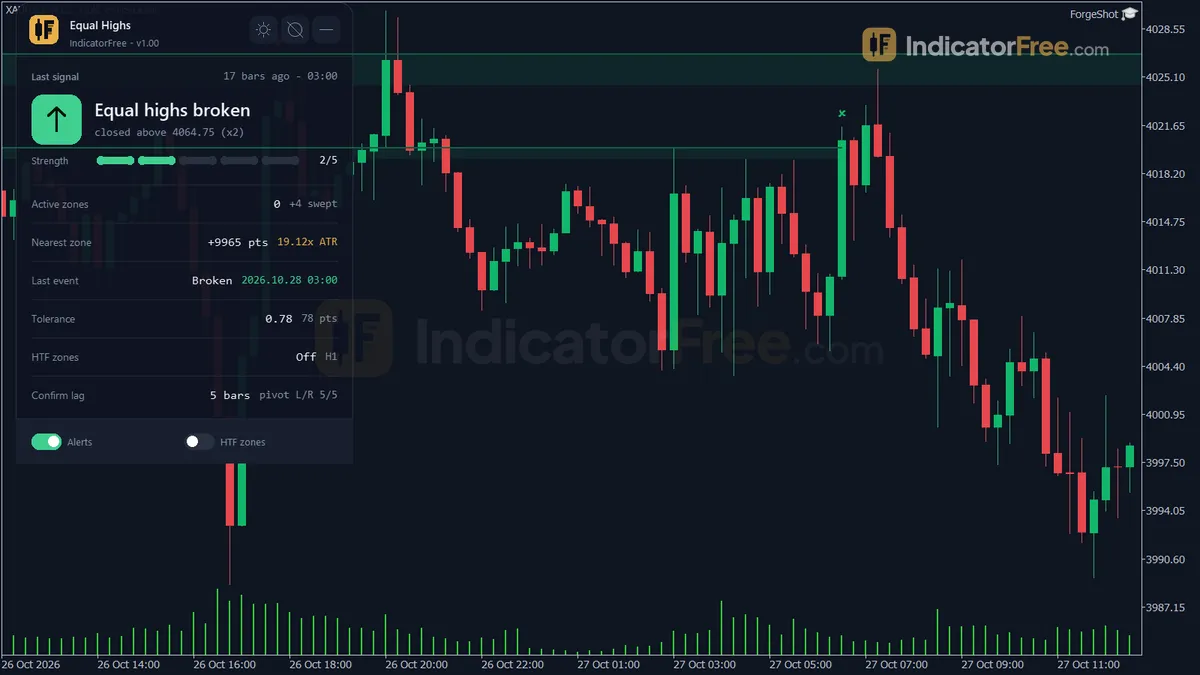
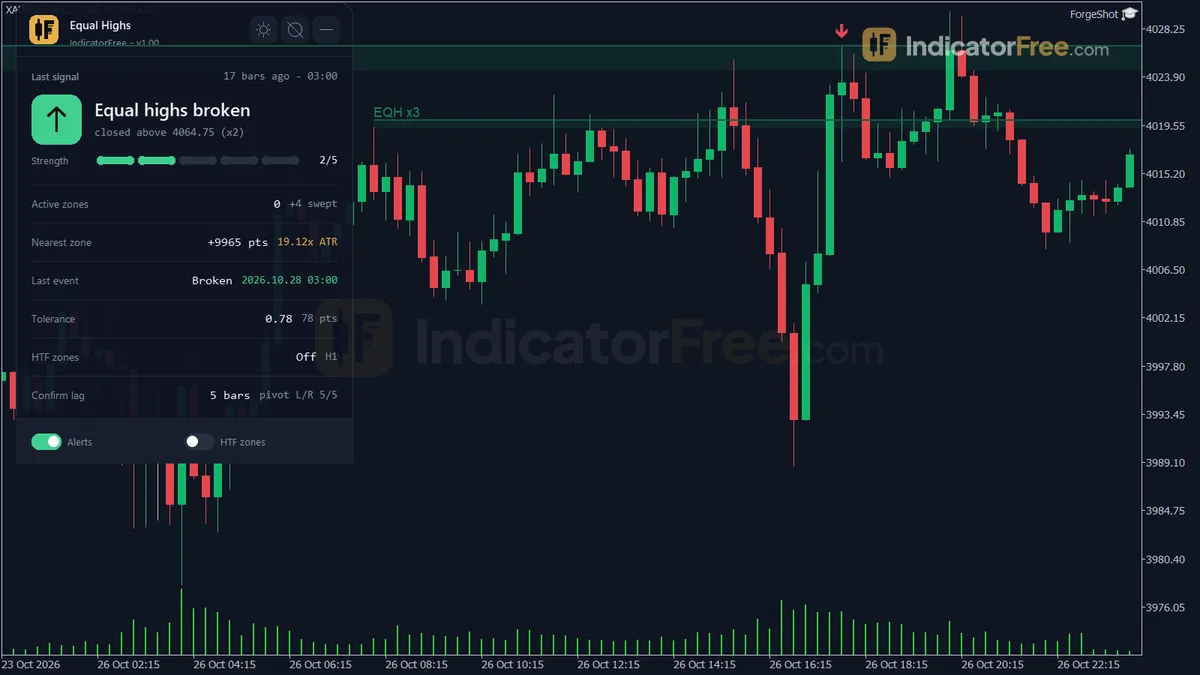
The tool marks two events with arrows: a Liquidity Sweep, where price pokes above the zone and closes back at or below the zone top, and a Zone Break, where a bar closes above it.
What it draws on your chart
Equal highs are two or more swing highs at nearly the same price. Many traders read them as a pool of buy-side liquidity, meaning stop orders resting just above. The tool turns that idea into objects you can see:
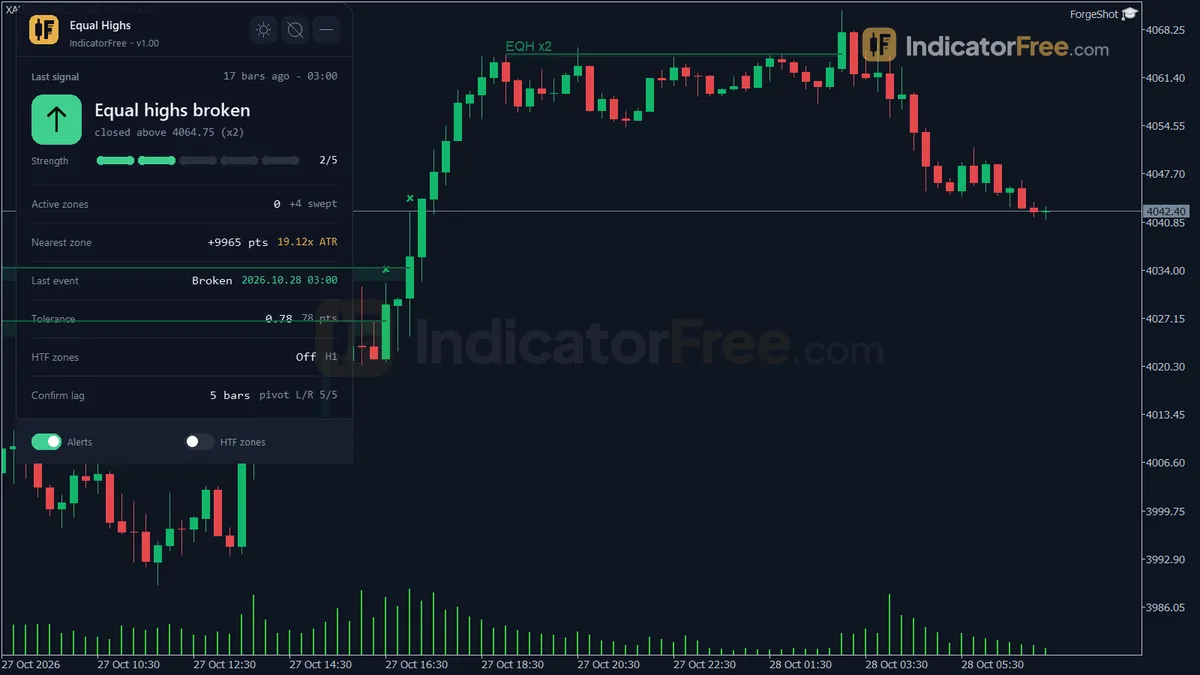
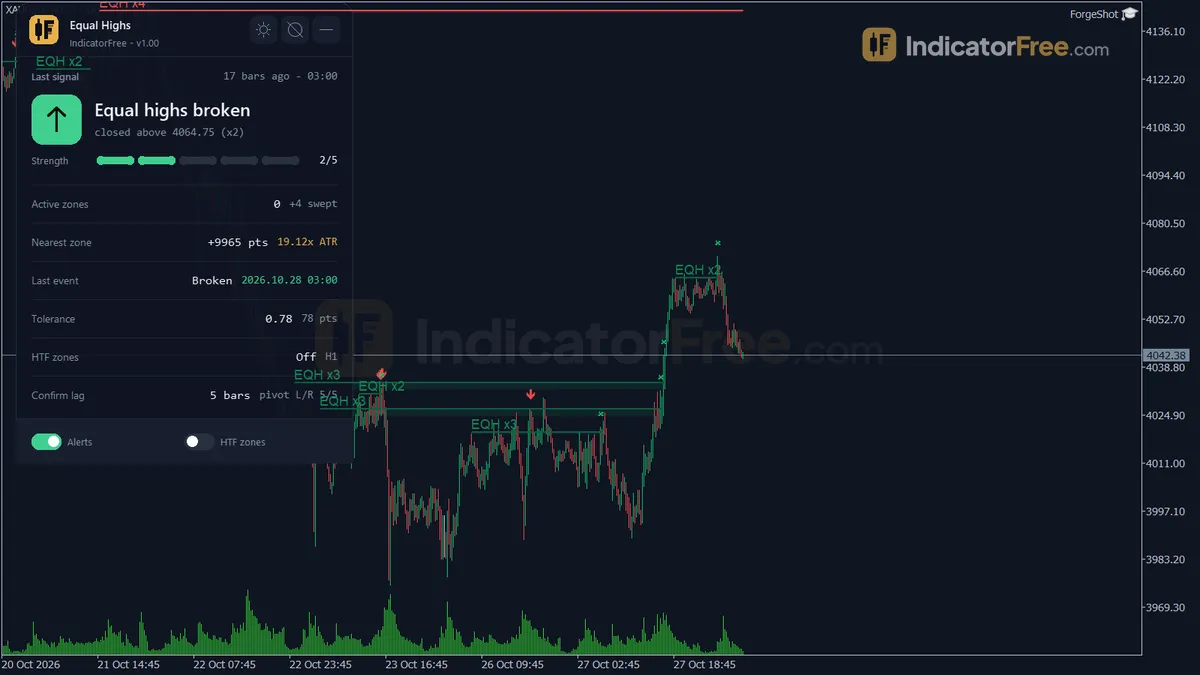
- Equal Highs zone: a rectangle around confirmed swing highs that sit within a tolerance of each other. One zone can hold more than two highs, and it keeps a running count of its touches. Each zone has one of three states: Active, Swept or Broken.
- Liquidity Sweep arrow and Zone Break arrow: these print on closed bars when price interacts with a zone.
- HTF Equal Highs: an optional overlay that draws dashed lines for zones found on a higher timeframe. It is off by default.
- Status panel: a summary of the zones and the latest events.
How the Lab tested it
The Lab ran version 1.00 on MT5 build 6230. The test used EURUSD M15 from 2026-07-06 to 2026-10-02, with real ticks from Raw Trading Ltd. The Lab logged every arrow as it appeared, then checked whether any of them moved or disappeared later. The result was 125 signals logged, 0 changed and a maximum arrow delay of 0 bars. In practice, an arrow appears on the close of the bar that triggers it and stays there. Arrows in history are where they printed live. Zones, though, appeared RightBars bars after their last high.
What the signal numbers mean
For each arrow, the Lab checked one thing: did price move 1 ATR in the signal's direction before it moved 1 ATR against it? The chart below shows the share of arrows where it did. For this check, the Lab scored sweep arrows as short (down) signals and break arrows as long (up) signals.
The two arrows behave very differently, so judge them separately:
- Sweep arrows reached 1 ATR their way first 61.9% of the time, but that is from only 42 signals in three months, so treat it as promising, not proven.
- Break arrows did slightly worse than a coin flip. On their own they carry no edge. Treat a break as information that the zone has failed, not as an entry.
These figures come from one symbol, one timeframe and one three-month window. They measure a 1 ATR move, not a full trade with spread, stop placement and exits.
How it works
- 1
- 2A zone engine groups pivot highs within a tolerance of each other, using fixed points and a share of ATR.
Tolerance from EqualTolerancePoints and EqualToleranceATRFrac x ATRInputs: EqualTolerancePoints, EqualToleranceATRFrac, ATRPeriod, MinTouches - 3Looks back a limited number of bars and drops zones older than the maximum age.Inputs: MaxLookbackBars, MaxZoneAgeBars
- 4Tracks each zone as active, swept or broken from later highs and closes, and marks sweeps and breaks with arrows.Inputs: ShowBrokenZones, AlertOnSweep, AlertOnBreak
- 5Optionally repeats the zone search on a higher timeframe with its own minimum touches.Inputs: EnableHTFOverlay, HTFPeriod, MinTouchesHTF
Specifications
- Platform
- MetaTrader 5
- Version
- 1.00
- Type
- Indicator
- Window
- Main chart
- Draws
- 2 arrows, 2 zones, 1 panel
- Alerts
- popup, push, sound
- Repaints
- No (0 of 125 signals changed)
- Inputs
- 23
- Tested on
- MT5 build 6230 · 2026-10-04
Repaint test
No repaint detected. In a 6 Jul 2026 – 2 Oct 2026 test on EURUSD M15 (Raw Trading Ltd real ticks), 125 signals were logged at bar close and re-read at the end of the test: 0 changed. Arrows print on the bar that closes the signal, with no delay.
IndicatorFree — tested 2026-10-04 · MT5 build 6230 · Raw Trading Ltd real ticks. Results come from historical data, not live trading, and do not guarantee future results.
Signal statistics
Over 6 Jul 2026 – 2 Oct 2026 on EURUSD M15, the indicator printed 125 arrows. After 52.8% of them, price moved 1×ATR(14) in the arrow's direction before moving 1×ATR against it (median 2 bars). 0.8% reached neither level within 20 bars.
This measures price movement after the arrow, not a trading result. It includes no spread, commission, stop loss or position sizing.
What it draws
- Arrows (Liquidity Sweep) from buffer 0, drawn on the closed bar.
- Arrows (Zone Break) from buffer 1, drawn on the closed bar.
- Rectangles (Equal Highs) drawn as chart objects, not buffers — they are not readable by iCustom() in an EA.
- Rectangles (HTF Equal Highs) drawn as chart objects, not buffers — they are not readable by iCustom() in an EA.
- An on-chart panel (Status); values shown in the panel are not exposed as buffers.
Inputs
| Input | Default | What it does |
|---|---|---|
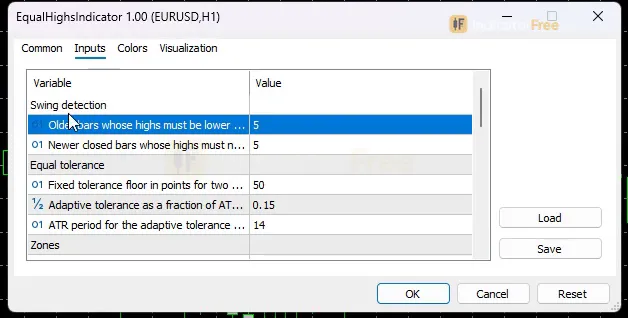
| LeftBars | 5 | Older bars whose highs must be lower for a swing high (2-15) |
| RightBars | 5 | Newer closed bars whose highs must not be higher (2-15), also the confirmation lag in bars |
| EqualTolerancePoints | 50 | Fixed tolerance floor in points for two highs to count as equal (0-500) |
| EqualToleranceATRFrac | 0.15 | Adaptive tolerance as a fraction of ATR; the larger of the two is used (0.0-1.0) |
| ATRPeriod | 14 | ATR period for the adaptive tolerance and the panel distance (5-50) |
| MinTouches | 2 | Swing highs needed before an Equal Highs zone is drawn (2-5) |
| MaxLookbackBars | 500 | How far back (bars) a new swing high may match an earlier one (100-5000) |
| MaxZoneAgeBars | 300 | Hide an Active zone after this many bars without a new equal high (0 = never) |
| ShowBrokenZones | true | Keep broken zones as faded history instead of deleting them |
| EnableHTFOverlay | false | Also draw Equal Highs found on a higher timeframe (dashed) |
| HTFPeriod | H1 | Higher timeframe for the overlay (must be above the chart timeframe) |
| MinTouchesHTF | 2 | Swing highs needed for a higher-timeframe zone (2-5) |
| AlertOnNewZone | false | Alert when a new Equal Highs zone forms |
| AlertOnSweep | true | Alert when a zone is swept (high above, close back at or below) |
| AlertOnBreak | false | Alert when a bar closes above a zone |
| AlertPopup | true | Show a popup alert |
| AlertPush | false | Send a push notification to the MT5 mobile app |
| AlertSound | true | Play a sound |
| SoundFileName | alert.wav | Sound file played when AlertSound is on |
| ShowDashboard | true | Show the status panel |
| PanelScale | 1 | Panel size multiplier (DPI is applied automatically) |
| Theme | Dark | Chart color theme |
| RestoreTheme | true | Restore the original chart colors when the indicator is removed |
How to read it
Install it and take a first look
Copy the file into MQL5/Indicators, refresh the Navigator and drag Equal Highs onto a chart. The zones draw on the price chart itself, not in a separate subwindow.
Reading an Equal Highs zone
The tool first looks for swing highs. A swing high is a bar whose high is above the LeftBars older highs and not below the RightBars newer highs. It then groups swing highs that sit within a tolerance of each other. The tolerance is the larger of two values: EqualTolerancePoints (a fixed number of points) or EqualToleranceATRFrac × ATR. When MinTouches swing highs fall inside that tolerance, a zone is drawn.
Two things about timing:
- Zones appear late on purpose. A swing high only counts once
RightBarsbars after it have closed. With the default of 5, a zone appears 5 bars after the last high that completes it. This is confirmation lag, not repainting, and the panel shows it. - Zones expire. If no new equal high joins an Active zone for
MaxZoneAgeBarsbars (default 300), the zone is hidden. WithShowBrokenZoneson, broken zones stay on the chart as faded history instead of being deleted.
Reading the two arrows
Together the two arrows fired 9.8 times a week on the Lab's EURUSD M15 test.
Liquidity Sweep fires when a closed bar's high trades above the top of an Active zone but the bar closes at or below that top. In other words, the stops above the highs were taken, but buyers could not hold price above them. It fired 3.3 times a week in the test. Read it as a possible short idea.
Decision rule: take a sweep arrow only if the sweep bar's close is clearly back inside or below the zone. Skip it if the next bar closes above the zone top, because that turns it into a break. Many traders place the stop a little above the sweep bar's high.
Zone Break fires when a closed bar closes above the top of an Active zone or a Swept zone. It fired 6.5 times a week in the test, about twice as often as the sweep. Read it as "this level failed", not as a buy button.
Decision rule: use a break arrow to exit or cancel a short idea based on that zone. Only consider it as a long setup if another tool already gives you a reason to buy.
The illustration below shows both events on one zone.
A common misread
A long wick above the zone is not a break. A break needs a bar to close above the zone top. The opposite mistake matters more: a sweep does not end the zone. A Swept zone can still give a Zone Break later, as in the illustration. If you are short from a sweep and a break arrow prints, the idea behind the trade has failed.
The inputs to change first
EqualToleranceATRFrac(default 0.15, range 0.0-1.0) controls how close two highs must be to count as equal, and it is the main input behind both arrows. Raise it and you get more zones that are looser. Lower it and you get fewer zones that are tighter.EqualTolerancePoints(default 50, range 0-500) sets a floor for the tolerance. Because the larger of the two values is used, on a calm chart this floor can decide the tolerance on its own. Check the current tolerance in the panel.MinTouches(default 2, range 2-5): more touches means fewer zones, but each one holds more highs.LeftBarsandRightBars(default 5, range 2-15) set how big a swing must be to count. A higherRightBarsmeans bigger swings, but zones appear later.MaxLookbackBars(default 500) andMaxZoneAgeBars(default 300; 0 means never hide) control how far back the tool searches for matches and how long zones stay on the chart.
Higher-timeframe overlay
Set EnableHTFOverlay to true and pick HTFPeriod (default H1), which must be higher than your chart timeframe. Higher-timeframe zones draw as dashed lines and use their own MinTouchesHTF. They are rebuilt from closed higher-timeframe bars each time a new higher-timeframe bar opens, and they are deleted when you turn the overlay off.
Alerts
There are three triggers: AlertOnSweep (on by default), AlertOnNewZone and AlertOnBreak (both off by default). Each alert can arrive as an MT5 popup (AlertPopup, on), a sound (AlertSound, on, using SoundFileName) or a push notification to the MT5 mobile app (AlertPush, off).
Status panel
When ShowDashboard is on, the panel shows:
- the last zone event
- how many zones are Active and how many are Swept
- the distance to the nearest zone, in points and in ATR
- the last sweep or break
- the current tolerance
- the number of higher-timeframe zones and the confirmation lag
PanelScale resizes the panel.
Installation
- 1Download EqualHighsIndicator.ex5 from the button above (Google Drive).
- 2In MetaTrader 5: File → Open Data Folder → MQL5 → Indicators. Copy EqualHighsIndicator.ex5 there.
- 3Restart MT5 or right-click Indicators in Navigator → Refresh.
- 4Drag Equal Highs onto a chart. For push alerts, enable "Allow push notifications" under Tools → Options → Notifications.
- Tested on MT5 build 6230.
Key terms and guides
- Liquidity
- Liquidity is how easily you can buy or sell without moving the price. On a chart, traders also use the word for the clusters of stop-loss and pending orders that sit above swing highs and below swing lows.
- Average True Range
- Average True Range (ATR) is a volatility indicator that shows how far price typically moves per candle, gaps included, averaged over a set number of candles. It measures the size of moves, not their direction.
- Equal highs
- Equal highs are two or more swing highs that top out at almost the same price. Many traders set stop losses and buy orders just above them, so the level often gets tested or briefly broken.
- Every tick based on real ticks
- Every tick based on real ticks is the MT5 Strategy Tester mode that replays the actual bid and ask ticks your broker recorded, with the real changing spread, instead of ticks the tester invents from 1-minute bars.
- Higher Timeframe
- A higher timeframe is any chart period longer than the one you trade on, such as the daily chart for someone trading the 1-hour chart. Traders use it to see the bigger trend and the main price levels around their smaller-chart trades.
- Candlestick
- A candlestick is one bar on a price chart that shows four prices for a set period: the open, high, low and close. A thick body spans the open and close, and thin wicks reach the high and low.
- Guide: What Is a Fair Value Gap in Forex? How to Spot and Trade One
- Guide: How to Read Candlestick Charts: Bodies, Wicks and Shapes Explained
More on this subject: Price action & SMC guide, terms and tools
User reviews
No reviews yet. Members who download the tool can review it here.
Sign in and download the tool to review it.
Build a checklist with it
Equal Highs does one job on the chart: zone / level. Put it on the same chart as the tools below and the IndicatorFree panels merge into one checklist card, ordered trend, zone, signal, risk.
- Trend / contextADXAdds the trend side: which way the market leans before you act on Equal Highs.
- Entry signalDisplacementAdds the entry signal: the moment to act once Equal Highs has set the scene.
The Lab has not tested these combinations. Each tool is tested on its own; the card only lines up what each one says. Free members get 2 new tools a day. If one has to wait until tomorrow, install BlackBox to raise the limit to 5 a day (20 on a live account).
FAQ
Does Equal Highs repaint?
No repaint detected. In a 6 Jul 2026 – 2 Oct 2026 test on EURUSD M15 (Raw Trading Ltd real ticks), 125 signals were logged at bar close and re-read at the end of the test: 0 changed. Arrows print on the bar that closes the signal, with no delay.
Can I use Equal Highs in an EA?
Yes. Read buffer 0 (Liquidity Sweep) with iCustom() on bar 1 — the last closed bar.
Why can’t my EA read the zones?
Zones and the panel are chart objects, not indicator buffers, so iCustom() does not return them.
How do I get alerts on my phone?
Enter your MetaQuotes ID under Tools → Options → Notifications, tick "Enable push notifications", and keep the push alert input on.
Does it work on other pairs?
Tested on EURUSD only; other symbols not tested.
Why didn't a sweep arrow print when the wick went above the zone?
A Liquidity Sweep is only checked on a closed bar, and that bar must close back at or below the zone top. If it closed above the top, you get a Zone Break instead. The zone must also still be Active: a zone that has already been swept can give a break later, but not a second sweep.
What does the tolerance number in the panel mean?
It is the price distance the tool is using right now to decide whether a new swing high matches an existing zone. Because it follows ATR over `ATRPeriod` bars (14 by default), it widens when bars get bigger and narrows when they get smaller, but never drops below the `EqualTolerancePoints` floor.
Can I get alerts on my phone?
Yes. Set `AlertPush` to true, and MT5 sends a push notification to the MT5 mobile app after you enter your MetaQuotes ID under Tools > Options > Notifications. You choose which events trigger alerts with `AlertOnSweep`, `AlertOnNewZone` and `AlertOnBreak`.
Will it change my chart colors?
Yes. It applies the color theme set in `Theme` (Dark by default). If `RestoreTheme` is left on, your original chart colors come back when you remove the indicator.
Which version did the Lab test, and how big is the file?
The Lab tested version 1.00, a 153.2 KB file, on 2026-10-04. It runs in the main chart window, not in a subwindow.
Changelog
- 1.00Initial release: ATR-adaptive Equal Highs zone detection, grouping multiple confirmed swing highs (not just pairs) into one liquidity zone with a running touch count. · 2026-10-05
Final verdict
Where it earns its place
The Liquidity Sweep arrow is the reason to download this tool. It was the better of the two signals in the Lab test, and its arrows stay where they print. Price moved fast after both arrows: the median arrow saw a 1 ATR move, in either direction, within 2 bars (about 30 minutes on M15). Only 0.8% of all arrows failed to reach 1 ATR either way within 20 bars, and no sweep arrow failed to (0.0%), so have your stop planned before you act on the arrow.
The zone engine is also tidy. It groups several highs into one zone instead of drawing a line for every pair, sizes its tolerance from ATR, and hides old zones on its own.
What it cannot do
- It only finds equal highs. It draws no equal lows and no sell-side zones.
- The break arrow is not an entry. It tested below a coin flip. Use it to manage a trade, not to start one.
- It does not give stops, targets or position size. The Lab measured a 1 ATR move, not a complete trade.
- It was tested on one market. The test covered EURUSD M15 only. Other symbols and timeframes are untested.
- Zones come with confirmation lag of
RightBarsbars. - It changes your chart colors while it is attached.
Who should skip it
Skip it if you want a complete buy/sell system, if you trade from lows as often as highs and want both sides in one tool, or if you don't use liquidity concepts at all. Without that context, the arrows are just marks on the chart.
- –You trade rejections of obvious highs and want sweeps flagged on closed bars
- –You want alerts for sweeps instead of watching the chart
- –You use break arrows to cancel or exit a short idea
- –You add a higher-timeframe view with the dashed overlay
- –You want buy and sell entries from one arrow type
- –You need equal lows or sell-side zones
- –You plan to buy every Zone Break arrow on its own
- –You need a zone the moment the second high prints
Settings to start with
Start on the defaults: LeftBars and RightBars at 5, EqualToleranceATRFrac at 0.15, MinTouches 2, and AlertOnSweep on with the other alert triggers off. These are the settings the Lab tested.
If you trade M15, try setting EnableHTFOverlay to true with HTFPeriod H1 so you can see which zones also exist on the higher timeframe. If your chart is crowded with zones, try MinTouches 3 or EqualToleranceATRFrac 0.10. All three suggestions are untested by the Lab, so compare them with the defaults on your own symbol before you rely on them.
An idea to pair it with
An idea the Lab has not tested: pair it with Liquidity Map to see the levels below a sweep.