Higher High
Free Higher High indicator for MT5: marks confirmed Higher Highs and Lower Highs with arrows and adds a structure panel.
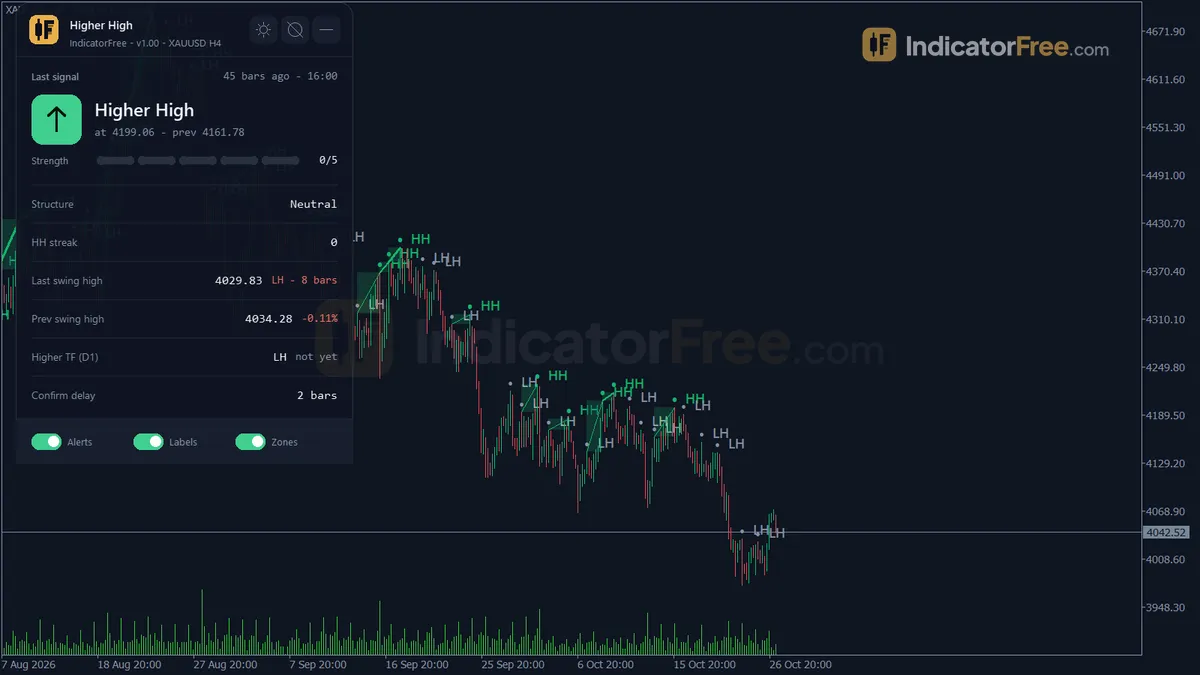
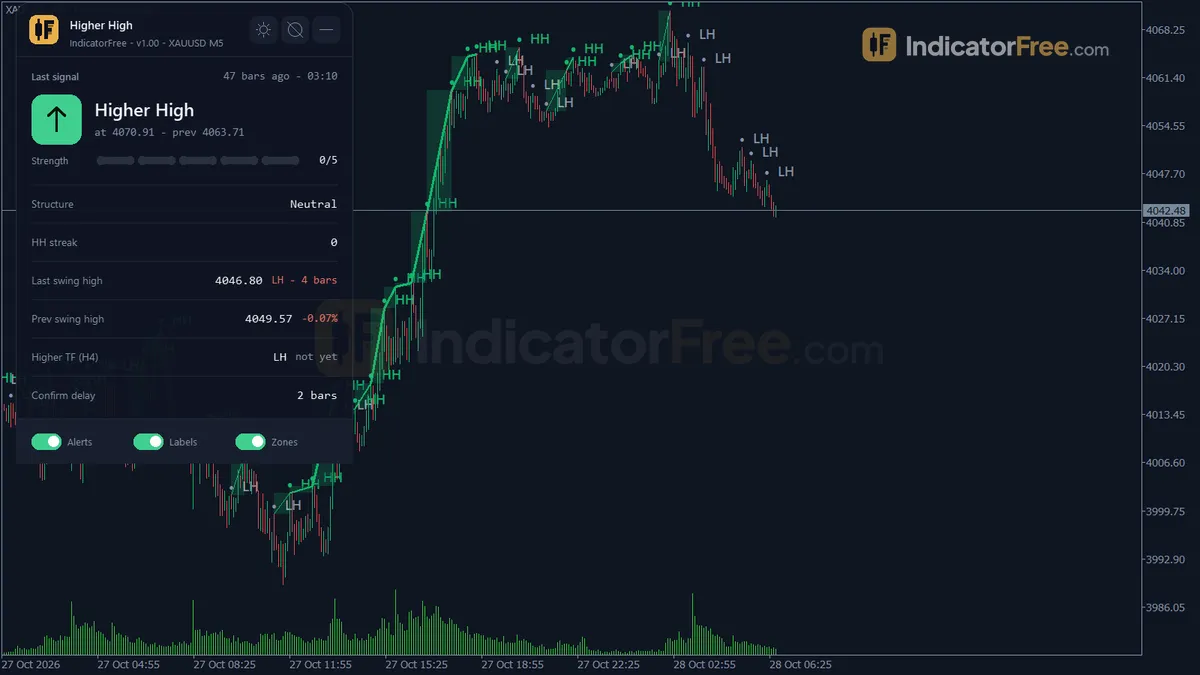
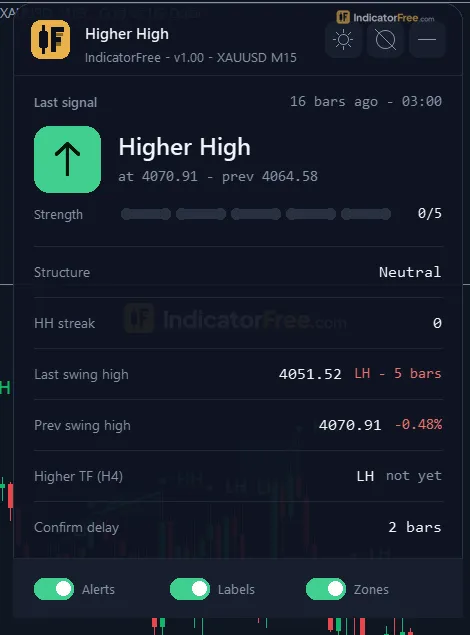
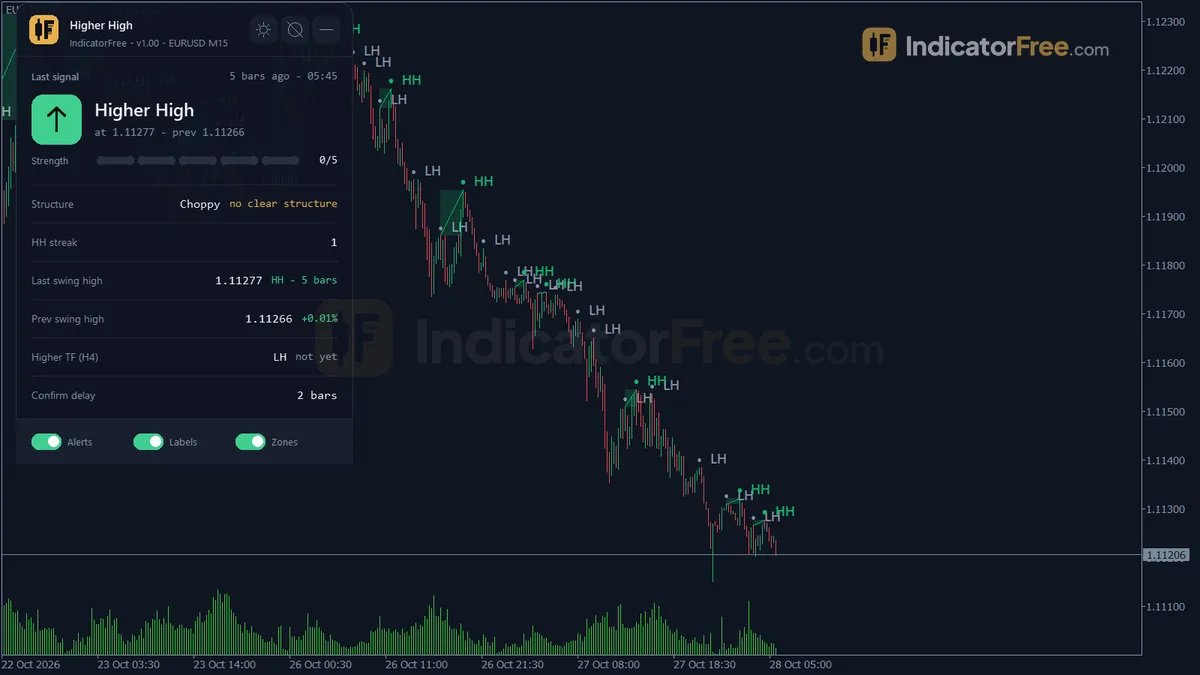
- Repainted
- 0 / 825
- Signals / week
- ≈ 64.9
- Tested on
- EURUSD M15
- Tested
- 2026-10-04
Overview
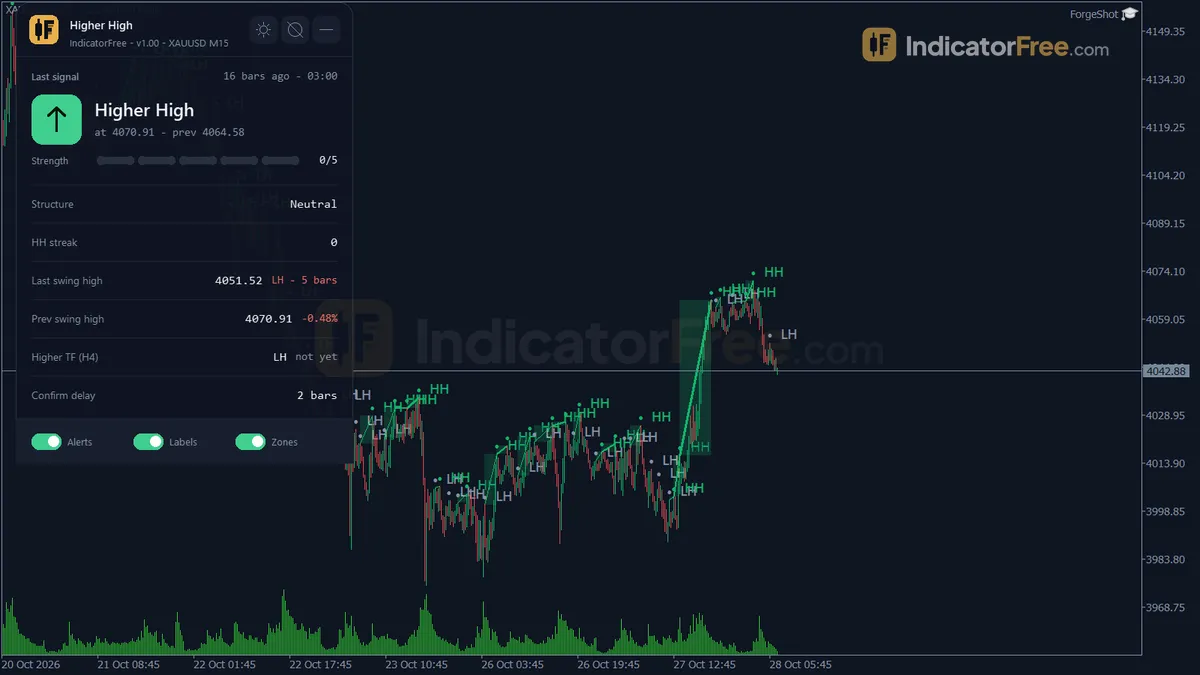
Higher High is a free MT5 indicator for trend and pullback traders who want a rule-based check that highs keep stepping up. It works in the main price window. It marks every confirmed swing high as a Higher High or a Lower High with an arrow, and it can shade the area between two highs and show a structure panel. In the Lab's repaint test on EURUSD M15, 0 of 825 signals changed after they appeared. It helps you check, at a glance, whether an uptrend is still making new highs or has started to stall.
What it puts on your chart
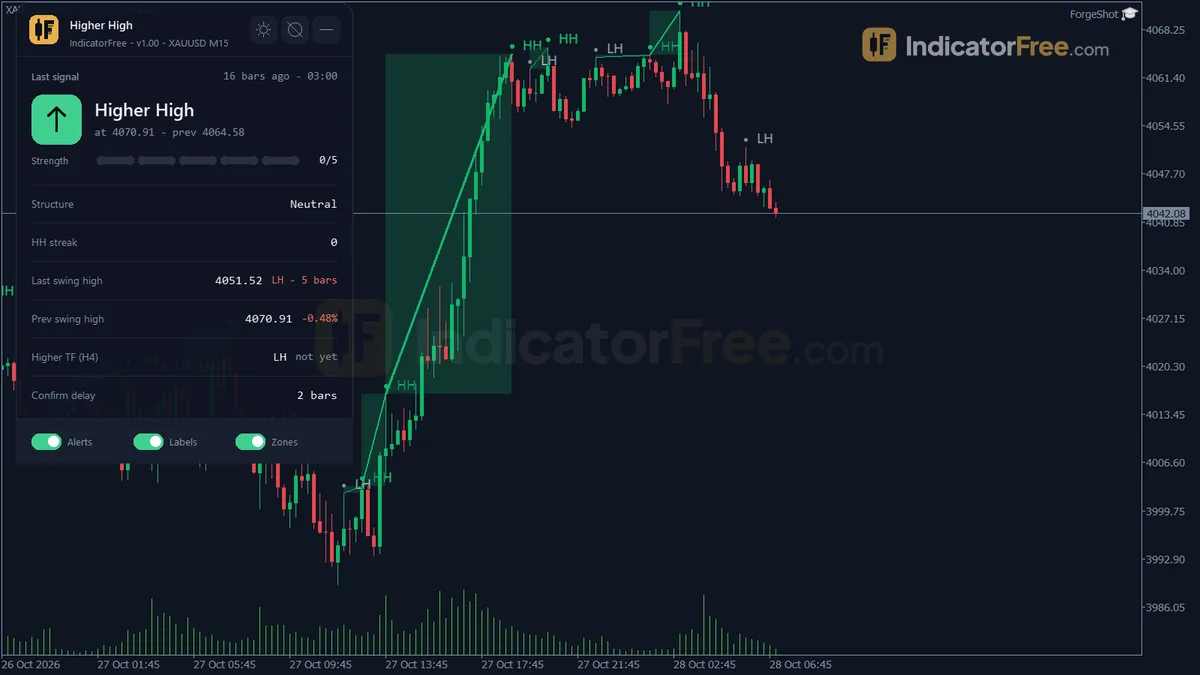
A swing high is a bar whose high sits above the bars around it. Comparing one swing high with the last one is the core of market structure. The indicator draws:
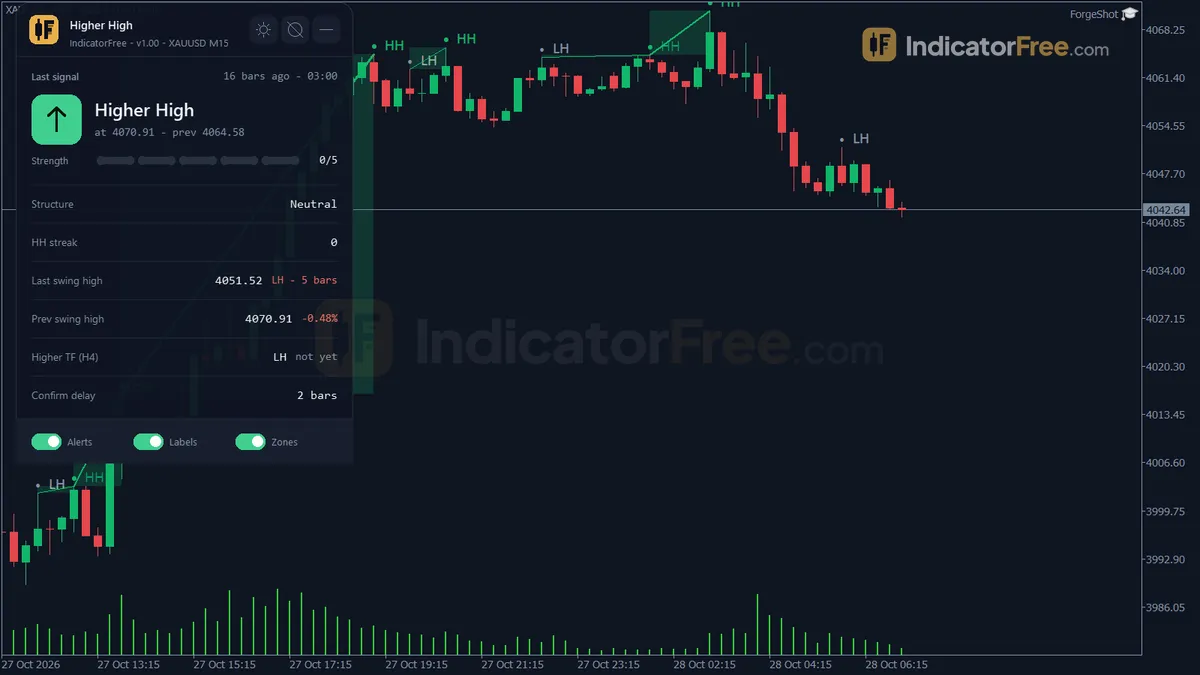
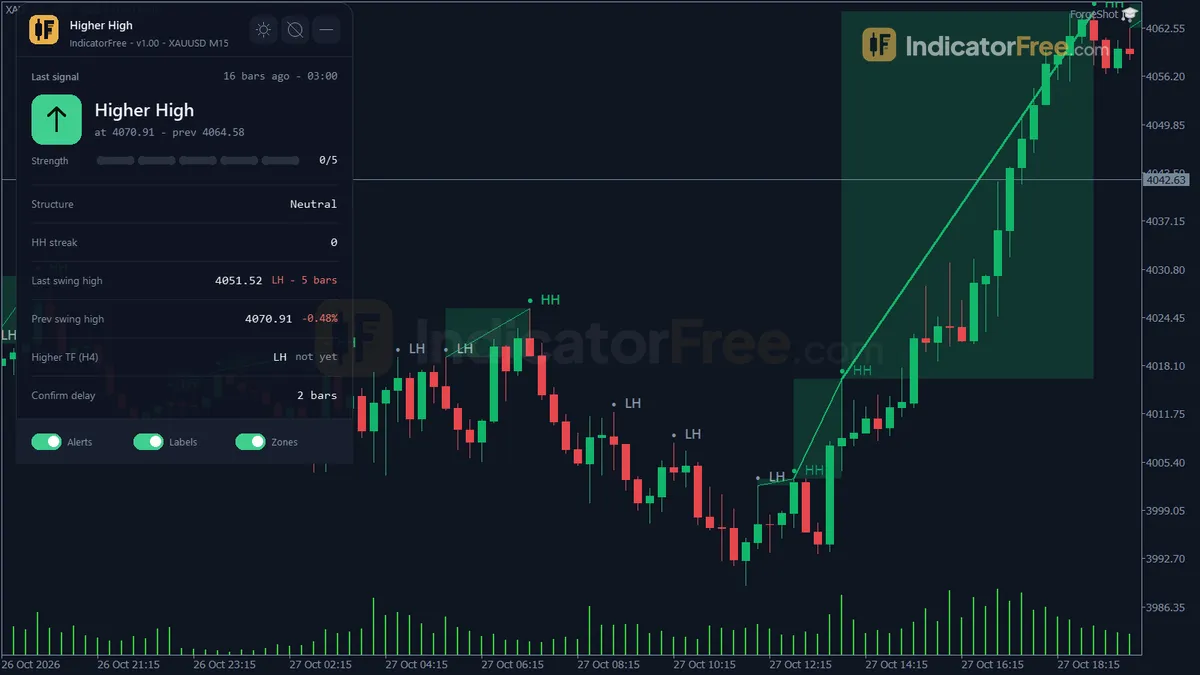
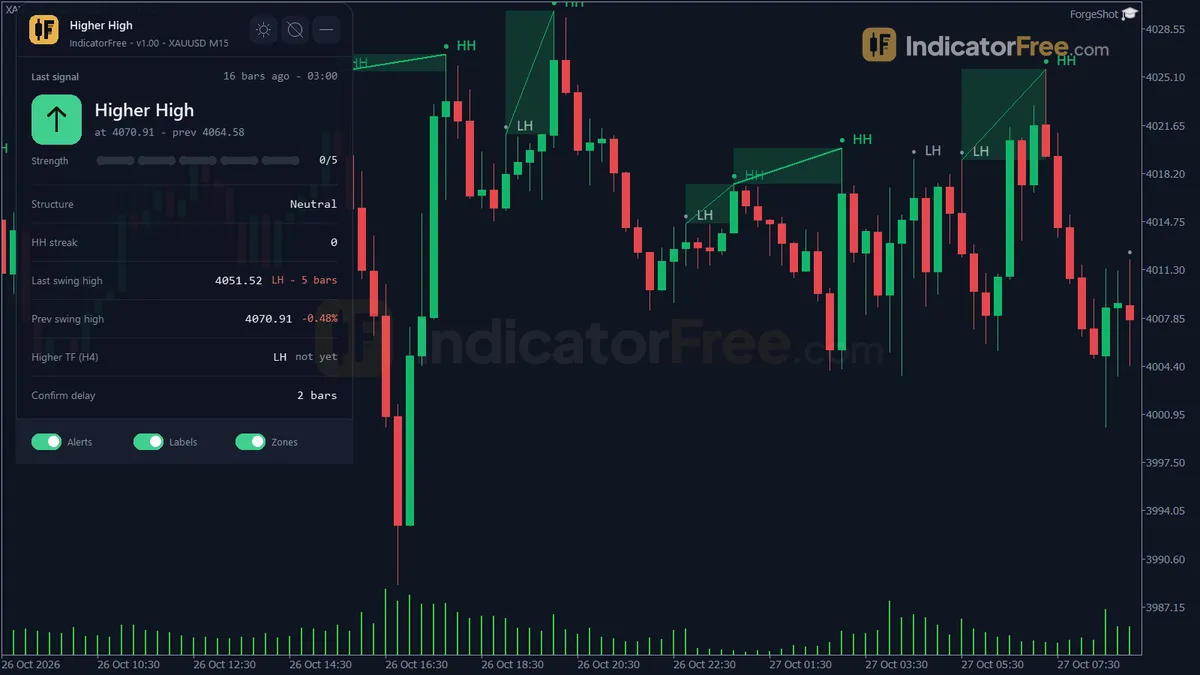
- Higher High arrow (buffer 0): a swing high whose high is at least one point above the previous confirmed swing high.
- Lower High arrow (buffer 1): a swing high at least one point below the previous one.
- HH / LH / EH labels: text at each swing high. EH (equal high) is a label only and has no arrow.
- HH Leg: a trendline joining the swing highs in a Higher High run.
- HH Zone: a shaded rectangle between two swing highs when a Higher High is confirmed.
- Structure panel: the last Higher High, the structure state (uptrend, choppy or neutral), the HH streak, the last and previous swing high with the distance between them in percent, and the higher timeframe's structure.
When more than MaxSwingsShown swing highs carry objects, the lines, zones and labels are deleted oldest first, so the chart stays readable.
How the Lab tested it
The Lab ran version 1.00 (140.7 KB) on MT5 build 6230. Testing was done on 2026-10-04 using EURUSD M15 from 2026-07-06 to 2026-10-02 with Raw Trading Ltd real ticks.
- Repaint: the Lab logged 825 arrows while the test ran and compared them with the finished chart. None of them moved or disappeared. The longest delay was 2 bars, which matches the default
SwingStrengthof 2: a swing high only becomes final once 2 more bars have closed. In plain words, an arrow you see stays put, but it always shows up a couple of bars after the high itself. - Frequency: 64.9 signals a week on EURUSD M15. That is 31.3 Higher High and 33.6 Lower High arrows. On M15 this is a busy tool, not one that rarely fires.
What price did after the arrows
For each arrow the Lab checked whether price reached 1 ATR on the side the Lab tests before it reached 1 ATR on the other side. The Lab has not published which side that is for each arrow. So do not read these numbers as "price went up after a Higher High". Read them as "the Lab's tested side was hit first this often".
The chart below shows that share for each arrow type.
Scale zoomed in to show the difference (bars do not start at zero).
What this tells you:
- Price almost always moved 1 ATR within 20 bars. Only 0.8% of Higher High arrows, 2.6% of Lower High arrows and 1.7% overall reached neither side within 20 bars. A confirmed swing high on M15 is rarely followed by flat price.
- The tested side won about three times in four. The median wait for that hit was 2 bars for Higher Highs and 3 bars for Lower Highs (2 overall).
- This is not a profit figure. It says nothing about spread, where you entered or where you exited, and it covers only one symbol on one timeframe.
Who it is for
It suits traders who already trade trends or pullbacks and want a fixed, rule-based read of whether highs keep stepping up, along with a check against the higher timeframe. It is not a stand-alone entry system.
How it works
- 1Finds swing highs: a high above the set number of bars each side, confirmed after those bars close.
Swing high if High > left bars' highs and High >= right bars' highsInputs: SwingStrength - 2Compares each swing high with the previous: higher is a Higher High, lower a Lower High, equal neutral.
Higher High if swing high - previous swing high > half a point - 3Counts how many Higher Highs happen in a row, and resets the count after a Lower High.
- 4Flags choppy structure when the recent swing labels over the lookback keep alternating.Inputs: ChopLookback, AlertChop
- 5Reads the last 500 bars of a higher timeframe and shows its latest swing high direction and streak.Inputs: UseHigherTF, HigherTFMode, HigherTFManual
Specifications
- Platform
- MetaTrader 5
- Version
- 1.00
- Type
- Indicator
- Window
- Main chart
- Draws
- 2 arrows, 3 zones, 1 panel
- Alerts
- popup, push, sound
- Repaints
- No (0 of 825 signals changed)
- Inputs
- 16
- Tested on
- MT5 build 6230 · 2026-10-04
Repaint test
No repaint detected. In a 6 Jul 2026 – 2 Oct 2026 test on EURUSD M15 (Raw Trading Ltd real ticks), 825 signals were logged at bar close and re-read at the end of the test: 0 changed. Arrows appear up to 2 bars after the event they mark.
IndicatorFree — tested 2026-10-04 · MT5 build 6230 · Raw Trading Ltd real ticks. Results come from historical data, not live trading, and do not guarantee future results.
Signal statistics
Over 6 Jul 2026 – 2 Oct 2026 on EURUSD M15, the indicator printed 825 arrows. After 75.2% of them, price moved 1×ATR(14) in the arrow's direction before moving 1×ATR against it (median 2 bars). 1.7% reached neither level within 20 bars.
This measures price movement after the arrow, not a trading result. It includes no spread, commission, stop loss or position sizing.
What it draws
- Arrows (Higher High) from buffer 0, drawn on the closed bar.
- Arrows (Lower High) from buffer 1, drawn on the closed bar.
- Rectangles (HH Leg) drawn as chart objects, not buffers — they are not readable by iCustom() in an EA.
- Rectangles (HH Zone) drawn as chart objects, not buffers — they are not readable by iCustom() in an EA.
- Rectangles (HH LH Labels) drawn as chart objects, not buffers — they are not readable by iCustom() in an EA.
- An on-chart panel (Structure); values shown in the panel are not exposed as buffers.
Inputs
| Input | Default | What it does |
|---|---|---|
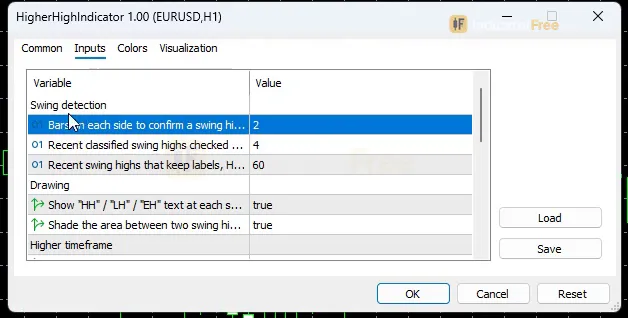
| SwingStrength | 2 | Bars on each side to confirm a swing high (1-10) |
| ChopLookback | 4 | Recent classified swing highs checked for choppy HH/LH alternation (3-10) |
| MaxSwingsShown | 60 | Recent swing highs that keep labels, HH lines and zones (10-300) |
| ShowLabels | true | Show "HH" / "LH" / "EH" text at each swing high |
| ShadeZone | true | Shade the area between two swing highs when a Higher High is confirmed |
| UseHigherTF | true | Compare with the swing structure of a higher timeframe |
| HigherTFMode | Auto | Auto picks the next higher timeframe, Manual uses HigherTFManual |
| HigherTFManual | H4 | Higher timeframe used when HigherTFMode = Manual |
| AlertPopup | true | Popup alert when a new Higher High is confirmed |
| AlertPush | false | Push notification when a new Higher High is confirmed |
| AlertSound | false | Play a sound when a new Higher High is confirmed |
| AlertChop | false | Also alert when the structure turns choppy (uses the channels above) |
| ShowDashboard | true | Show the on-chart panel |
| PanelScale | 1 | Panel size multiplier (DPI is applied automatically) |
| Theme | Dark | Chart color theme |
| RestoreTheme | true | Restore the original chart colors when the indicator is removed |
How to read it
How one signal forms
The steps below show how each arrow is built, from the swing check to the alert.
- 1Candidate highIts high is above the highs of SwingStrength bars on the left
- 2ConfirmationSwingStrength more bars close with no high above it, so the swing high is final
- 3CompareAt least one point above the previous swing high gives HH, at least one point below gives LH, equal gives an EH label only
- 4Update structureHH streak goes up by one, or resets after a Lower High. Chop is checked over ChopLookback swing highs
- 5AlertNew Higher High: popup, push or sound if switched on
Reading the arrows, lines and zones
The picture below shows how the drawings sit on price: a Higher High above an earlier swing high, then a Lower High under it.
With SwingStrength 2, the HH arrow would appear at bar 10 and the LH arrow at bar 15, once 2 more bars had closed after each high. The swing high at bar 3 gets no arrow, because the example has no earlier swing high to compare it with.
- Higher High arrow: the latest confirmed high beat the one before it. The HH streak in the panel counts how many came in a row. The HH Leg connects them, and a new HH Zone shades the gap between the two highs (if
ShadeZoneis on). - Lower High arrow: the latest high failed to reach the one before it, and the streak resets. One Lower High is a warning, not a downtrend.
- EH label: the two highs were equal, so the comparison is neutral.
Common misread: when you scroll back through history, the arrow sits right on the top bar, so it looks as if you could have sold the high or bought the breakout there. In live trading that arrow showed up only after SwingStrength more bars had closed. To judge any historical arrow fairly, look at the bar where it would have appeared, not the bar it points to.
Reading the panel
The panel puts the last Higher High, the HH streak, the last and previous swing high with their percent distance, and the higher timeframe's structure in one place. Choppy means the recent swing labels, counted over ChopLookback, keep switching between HH and LH. Uptrend and neutral are the panel's summary labels; their exact rule is not documented, so read them as a summary, not a checkable rule.
The higher timeframe reading uses the last 500 bars of that timeframe and shows its latest swing high direction and streak.
Inputs to change first
SwingStrength(default 2, range 1-10): how many bars on each side confirm a swing high. Higher values give fewer, larger swings and later arrows (2 bars late at default). On M5 you could try 4 to cut noise. That is a starting point the Lab has not tested, so compare it with the default.ChopLookback(default 4, range 3-10): how many recent swing highs are checked for HH/LH switching. A larger value needs a longer run of switching before the panel shows choppy.HigherTFMode/HigherTFManual: Auto uses the next higher timeframe. Choose Manual (default H4) if you always confirm against one fixed timeframe.MaxSwingsShown(default 60, range 10-300): how much drawing history stays on the chart. Lower it if the chart feels crowded.ShowLabels,ShadeZone,ShowDashboard,PanelScale,Theme,RestoreTheme: display options only. They do not change the signals.
Alerts
Alerts fire on a new Higher High only. AlertPopup is on by default and opens the MT5 alert window. AlertPush sends to the MT5 mobile app linked to your terminal. AlertSound plays a sound. Turn on AlertChop to get an alert through the same channels when the structure turns choppy.
A decision rule to try
Use the Higher High arrow as a trend-still-alive check, not as an entry:
- Keep a long bias only while the panel shows an HH streak of 2 or more and the higher timeframe structure points the same way.
- Plan your own entry on the next pullback. Do not buy the arrow bar itself; the arrow is 2 bars late at default.
- Stop adding to longs after a Lower High arrow, and stand aside while the panel says choppy.
This rule is an idea to try. The Lab has not tested it.
To install, copy the file into MQL5\Indicators through File > Open Data Folder, refresh the Navigator, then drag Higher High onto a chart.
Installation
- 1Download HigherHighIndicator.ex5 from the button above (Google Drive).
- 2In MetaTrader 5: File → Open Data Folder → MQL5 → Indicators. Copy HigherHighIndicator.ex5 there.
- 3Restart MT5 or right-click Indicators in Navigator → Refresh.
- 4Drag Higher High onto a chart. For push alerts, enable "Allow push notifications" under Tools → Options → Notifications.
- Tested on MT5 build 6230.
Key terms and guides
- Custom indicator
- A custom indicator is a chart tool written by a trader or outside developer instead of shipped with the trading platform. It runs its own formula on price or volume data and draws lines, arrows, zones or alerts on your chart.
- Multi-timeframe
- Multi-timeframe trading means reading the same market on two or three chart timeframes before a trade: a higher one for direction, a middle one for the price area, and a lower one to time the entry and place the stop.
- Uptrend
- An uptrend is a market where price keeps making higher highs and higher lows: each rally peaks above the last one, and each pullback stops above the previous low.
- Higher high
- A higher high is a swing high that peaks above the previous swing high. When higher highs and higher lows form in sequence, the market is in an uptrend.
- Swing High/Low
- A swing high is a candle whose high sits above the highs of the candles on both sides of it. A swing low is a candle whose low sits below the lows on both sides. Together they mark the turning points of price.
- Pullback
- A pullback is a short, temporary move against the main trend: price dips during an uptrend or rallies during a downtrend, then turns back the trend's way. Traders use it to enter a trend at a better price.
- Guide: Algo Trading in MT5 Meaning: How Expert Advisors Trade for You
- Guide: What Is a Fair Value Gap in Forex? How to Spot and Trade One
- Guide: How to Read Candlestick Charts: Bodies, Wicks and Shapes Explained
More on this subject: Price action & SMC guide, terms and tools
User reviews
No reviews yet. Members who download the tool can review it here.
Sign in and download the tool to review it.
Build a checklist with it
Higher High does one job on the chart: entry signal. Put it on the same chart as the tools below and the IndicatorFree panels merge into one checklist card, ordered trend, zone, signal, risk.
- Trend / context"Ichimoku Cloud"Higher High tells you when; this tells you which way the market leans, so you can skip signals against it.
- Zone / levelOrder Block LocatorShows the zones and levels, so you can see whether a signal from Higher High fires at a level worth trading.
The Lab has not tested these combinations. Each tool is tested on its own; the card only lines up what each one says. Free members get 2 new tools a day. If one has to wait until tomorrow, install BlackBox to raise the limit to 5 a day (20 on a live account).
FAQ
Does Higher High repaint?
No repaint detected. In a 6 Jul 2026 – 2 Oct 2026 test on EURUSD M15 (Raw Trading Ltd real ticks), 825 signals were logged at bar close and re-read at the end of the test: 0 changed. Arrows appear up to 2 bars after the event they mark.
Can I use Higher High in an EA?
Yes. Read buffer 0 (Higher High) with iCustom() on bar 1 — the last closed bar.
Why can’t my EA read the zones?
Zones and the panel are chart objects, not indicator buffers, so iCustom() does not return them.
How do I get alerts on my phone?
Enter your MetaQuotes ID under Tools → Options → Notifications, tick "Enable push notifications", and keep the push alert input on.
Does it work on other pairs?
Tested on EURUSD only; other symbols not tested.
Does Higher High mark higher lows or lower lows?
No. It finds and compares swing highs only, so you need a separate tool or your own reading for swing lows.
Can I get an alert when a Lower High prints?
No. Popup, push and sound alerts fire only on a new Higher High. The closest option is `AlertChop`, which alerts when the swing labels start switching between HH and LH.
Which higher timeframe does the panel compare with?
With `HigherTFMode` set to Auto it uses the next timeframe up from your chart. Set it to Manual to use `HigherTFManual`, which defaults to H4.
Why did my chart colors change when I attached it?
The `Theme` input (default Dark) recolors the chart. With `RestoreTheme` left on, your original colors come back when you remove the indicator.
Why do equal highs show a label but no arrow?
An arrow needs the new swing high to be at least one point above or below the previous one. When the two highs match, the indicator writes EH and treats the comparison as neutral.
Changelog
- 1.00Initial release: symmetric N-bar fractal swing-high detection with Higher High / Lower High / Equal High classification, HH streak counting with a thickening connector line, shaded zone between swing highs on a new. · 2026-10-05
Final verdict
Where it earns its place
The repaint result is the main reason to trust it: arrows are final once they appear, and the only cost is the delay set by SwingStrength, which you control. The structure panel adds real value. Streak, chop state and higher timeframe direction in one place save you from counting swing highs by hand.
Where it falls short
- Half the picture. It tracks swing highs only. You get no higher lows, lower lows or break-of-structure marks, so a downtrend shows up only as a run of Lower Highs.
- Direction is not proven. The Lab's 1 ATR figure does not say which way price went after each arrow, so it does not show that a Higher High predicts more upside.
- Always late. The arrow is 2 bars late at default, so it cannot catch the top or the breakout bar.
- One test market. Results cover EURUSD M15 only. Other pairs, gold, indices and other timeframes were not measured.
- Busy on low timeframes. That works out to about 13 arrows a day on EURUSD M15, and many will be minor swings.
Skip it if
Skip it if you want an entry arrow that tells you when to buy or sell, if you scalp the top of a move, or if you need full HH/HL/LH/LL structure from one tool.
Settings to start with
Start with the defaults: SwingStrength 2, ChopLookback 4, UseHigherTF on with Auto. On H4 and above you could try SwingStrength 3 for cleaner swings. The Lab has not tested that, so compare it with the default on your own chart. If you trade from a phone, turn on AlertPush and AlertChop.
One idea to try: add Liquidity Sweep to the same chart to see whether a new Higher High lines up with the levels that tool marks. The Lab has not tested the pair.