









Volatility & channels
- Indicators
- 6
- Expert Advisors
- 0
- Downloads
- 3
6 tools
| # | Tool | Type | Platform | Test result | Signals / week | Downloads | Released | |
|---|---|---|---|---|---|---|---|---|
| 1 |  Deviation SpectrumVolatility & channels | Indicator | MT5 | No repaint | — | 1 | 10 days ago | Get it |
| 2 |  Envelope BandsVolatility & channels | Indicator | MT5 | No repaint | 13.6 | 0 | 22 days ago | Get it |
| 3 |  Average Daily RangeVolatility & channels | Indicator | MT5 | No repaint | 2.3 | 1 | 22 days ago | Get it |
| 4 |  Donchian Channel PlusVolatility & channels | Indicator | MT5 | No repaint | 45 | 0 | 22 days ago | Get it |
| 5 | 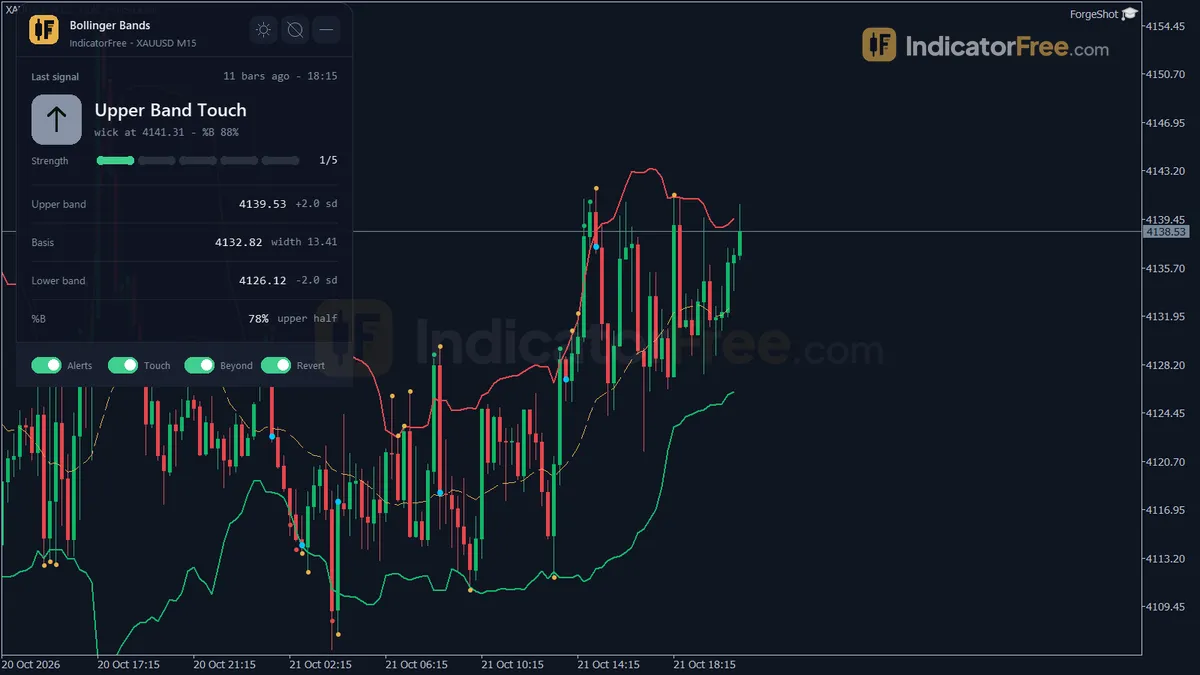 Bollinger BandsVolatility & channels | Indicator | MT5 | No repaint | 115.5 | 0 | 23 days ago | Get it |
| 6 | 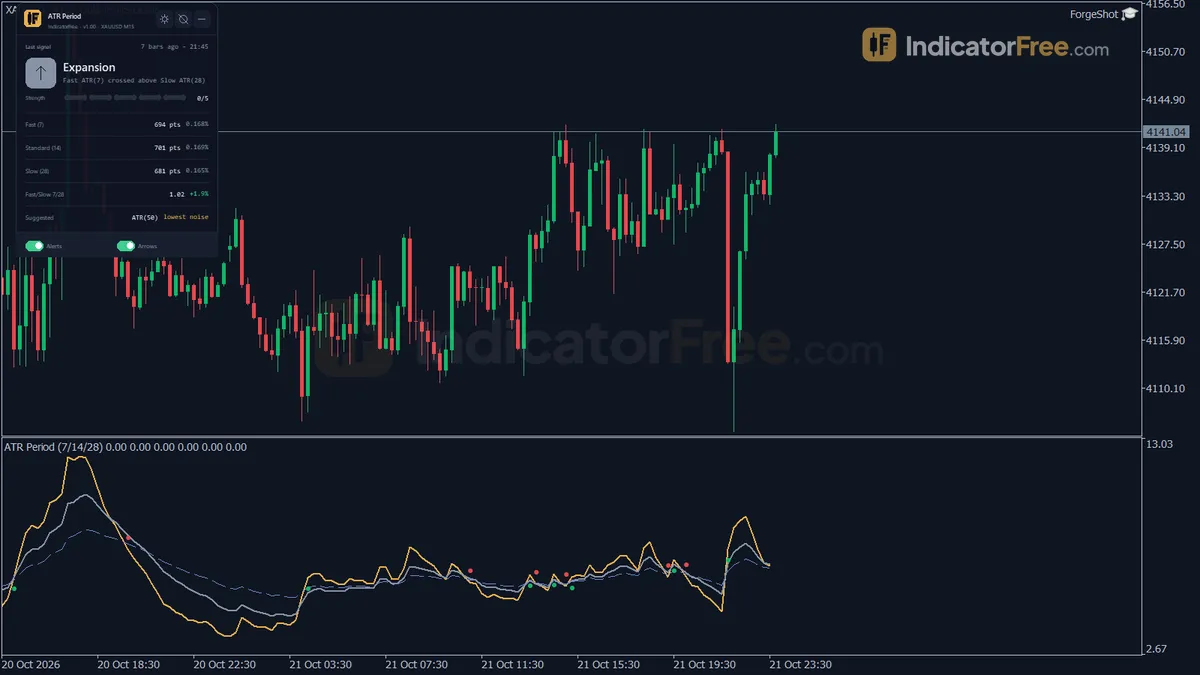 ATR PeriodVolatility & channels | Indicator | MT5 | No repaint | — | 1 | 23 days ago | Get it |
Volatility indicators measure how much price moves, not which way it goes. ATR, Bollinger Bands, Keltner and Donchian channels, envelopes and average daily range all answer one question: is the market quiet or busy right now? That answer helps you set stops that fit current conditions, size positions sensibly and notice when a calm period may be ending.
Range-based versus deviation-based volatility measures
Volatility is the size of price swings over a set period. Most tools here calculate it in one of two ways.
Range-based tools look at the distance between highs and lows. Average True Range (ATR) averages the true range of each candle, including gaps. Average daily range averages the high-to-low distance of whole days. Donchian channels plot the highest high and lowest low of the last N bars.
Deviation-based tools look at how far price strays from an average. Bollinger Bands sit a set number of standard deviations around a moving average. Envelopes sit a fixed percentage away. Keltner channels use a multiple of ATR around an average.
A wide ATR looks the same in a falling market as in a rising one.
ATR, Bollinger, Keltner or Donchian: which ruler to use
| Tool | What it shows | Useful for | Watch out for |
|---|---|---|---|
| ATR | Average candle size in price units | Stop distance, position size | No direction; jumps after news spikes |
| Average daily range | Typical full-day move | Daily targets, how much room is left today | Ignores session differences |
| Bollinger Bands | Standard-deviation envelope | Squeezes, stretch from the mean | Bands widen after the move has started |
| Keltner channel | ATR-based envelope | Smoother trend channels | Fewer touches, slower to react |
| Donchian channel | Highest high and lowest low | Breakouts of an N-bar range | Moves in steps, no smoothing |
| Envelopes | Fixed percentage band | Simple stretch zones | Percentage must be retuned per symbol |
A simple rule: to size stops, start with ATR. To see a range break, use Donchian. To see compression, use Bollinger Bands.
Size an ATR stop so the money at risk stays fixed
ATR makes your stop match the market instead of a fixed pip count. Example: You trade EURUSD on H1. ATR(14) reads 0.0012, which is 12 pips. You use an ATR multiplier of 1.5, so your stop is 12 x 1.5 = 18 pips. Your account is 5,000 USD and you risk 1%, which is 50 USD. 50 / 18 = about 2.8 USD per pip, or roughly 0.28 standard lots. On a news day ATR doubles to 24 pips. Now the stop is 36 pips and the size drops to about 0.14 lots.
Your stop got wider, but your money at risk stayed at 50 USD. That is the point. The Average True Range indicator gives you the number; the sizing logic is covered in what risk management means in trading. ATR uses past bars, so it lags after a shock.
Wait for a closed candle outside a Bollinger squeeze
A squeeze is when bands narrow to their tightest width in a while. Low volatility is often followed by volatility expansion, but a squeeze says nothing about direction.
The usual mistake is entering early. Price often pokes one way, then runs the other.
Before you act on a squeeze, check:
- Band width is the lowest in at least the last 50 to 100 bars.
- A candle has closed outside the band or channel, not just wicked through it.
- The break agrees with the direction of the higher timeframe.
- No major news release is due in the next hour.
A second misreading: "Price touched the upper Bollinger Band, so it must turn down." In a strong trend, price can ride the upper band for many bars. A touch means price is stretched, not that it will reverse.
Pair a volatility reading with a trend filter or session range
Volatility tools work best as a ruler or filter next to a tool that gives direction. If/then rules to try:
- If your trend filter points up and price pulls back to the middle Bollinger line, then treat that pullback as a possible entry and size the stop with ATR.
- If ATR is below its own 20-bar average and the Donchian channel has stayed flat for 20 bars or more, then expect a range and wait for a close outside it rather than taking trend entries.
- If today's move has already covered about 90% of the average daily range, then avoid chasing new entries that way.
They pair with the session tools in the breakout indicators group, where volatility shows whether a break has energy.
Every tool here lags, and the unfinished bar keeps changing until it closes, so act on closed bars only.
Record ATR at entry for your next 20 trades
Install one tool using the installation guide. On demo, add ATR(14) and Bollinger Bands (20, 2) to an H1 chart of a single pair. For your next 20 trades, write down the ATR value at entry and how far price went against you. You will see which stop multiple fits your style.